
The correlation of plasma proteins binding capacity and flavopiridol cellular and clinical trial studies
Abstract
Previous clinical research has suggested high-affinity binding of flavopiridol (FLAP) to human blood serum proteins, specifically either human serum albumin (HSA) or human alpha-1-acid glycoprotein (hAGP), when compared to fetal bovine serum albumin (BSA) or bovine alpha-1-acid glycoprotein (bAGP) used in pre-clinical assays. This high-affinity binding was suggested as the reason for its poor human clinical trial performance as a treatment for chronic lymphocytic leukaemia (CLL). Using three biophysical techniques, specifically circular dichroism (CD), isothermal calorimetry (ITC) and fluorescence spectroscopy, I show that FLAP does not have an overly high-affinity for either fetal BSA, HSA, bAGP or hAGP. I therefore suggest an alternate hypothesis that models the albumin and alpha-1-acid glycoprotein (AGP) binding sites at the different protein concentrations used in the fetal bovine pre-clinical assay and human physiological conditions. I use analytical ultracentrifugation (AUC) experiments to determine the validity of the theoretical models. The models can also be altered to account for the elevated AGP levels and reduced albumin levels seen in human cancer patients. Major differences in the concentrations of free available FLAP are observed between the fetal bovine pre-clinical model and human physiological conditions. A number of recommendations can therefore be made on how future pre-clinical assay studies should be conducted.
Abbreviations
AGP | alpha-1-acid glycoprotein |
AUC | analytical ultracentrifugation |
bAGP | bovine AGP |
BSA | bovine serum albumin |
BSAAff | fatty acid free BSA |
BSAFA | fatty acid bound BSA |
CD | circular dichroism |
CDK’s | cyclin dependent kinases |
CLL | chronic lymphocytic leukaemia |
DMSO | dimethylsulfoxide |
FBS | fetal bovine serum |
FLAP | flavopiridol |
hAGP | human AGP |
HAS | human serum albumin |
HSAAff | fatty acid free HSA |
ITC | isothermal calorimetry |
1.Introduction
Flavopiridol (FLAP, see Fig. 1) is a potent, cyclin-dependent kinase (CDK) inhibitor with high anti-cancer activity for chronic lymphocytic leukaemia (CLL) in pre-clinical fetal bovine serum cell assays [4]. However, in human clinical trials, FLAP demonstrated a poor therapeutic effect. This has been suggested to be due to high-binding affinity to either of the two main human blood serum proteins [6], namely serum albumin and alpha-1-acid glycoprotein (AGP). Serum albumin and AGP are known to bind a range of drugs, reducing the concentration and distribution of the free drug species, and, hence, their efficacy [8].
Fig. 1.
The molecular structure of flavopiridol (FLAP).
The binding affinities of flavopiridol for BSA, HSA, bAGP and hAGP have been experimentally determined using circular dichroism (CD), isothermal calorimetry (ITC) and fluorescence spectroscopy. A theoretical model was then constructed using the experimentally determined binding affinities to determine the concentration of free, unbound FLAP in fetal bovine cell assays and in healthy or disease state (i.e. cancerous) human patients. The amount of free drug is critical because it dictates how much of the drug is available in the blood stream to reach the drug’s cellular target (in this case, cyclin-dependent kinases (CDK’s)). There have been a number of examples of differential species dependent drug binding [1,19], but not as much attention has been paid to different protein concentrations in different experimental conditions. This can be of increased importance in disease states, such as cancer, when levels of AGP can increase by 2–10 fold and levels of serum albumin can decrease by 20–30% [2]. The level of changes observed depends on a number of factors, including cancer type, severity and the use of surgery [2,10,12]. The veracity of the theoretical models produced are then experimentally tested using an analytical ultracentrifugation (AUC) experiment.
2.Material and methods
All chemicals and proteins were purchased from Sigma-Aldrich (UK). FLAP (CAS: 146426-40-6, (-)-2-(2 Chlorophenyl)-5,7-dihydroxy-8-[(3S,4R)-3-hydroxy-1-methyl-4-piperidinyl]-4H-1-benzopyran-4-one hydrochloride –
2.1.Circular dichroism titration experiments
The CD samples were prepared in ddH2O. Human serum albumin fatty acid free (HSAAff) and Bos taurus bovine serum albumin fatty acid free (BSAAff) were made up to concentrations of
2.2.Isothermal calorimetry
Each ITC experiment was performed using a TA Instruments Nano Series machine using 1 mM FLAP solutions titrated in
2.3.Fluorescence
The fluorescence titration experiments were performed using the fluorescence attachment of a Chirascan-Plus spectrophotometer (Applied Photophysics Ltd., UK). A
Where
2.4.AUC
Sedimentation velocity experiments were conducted at 20°C at 129,024 g (RCF) using an An-60Ti rotor in a Beckman XL-I analytical ultracentrifuge. Absorption data was recorded at 280 nm. The resulting concentration distributions were processed exactly the same for each spectra and analysed by the SEDFIT program [7] to obtain the sedimentation coefficient distributions (
2.5.Calculation
2.5.1.Building a theoretical model of the fetal bovine assay and human system
Two independent binding site system. For the derivation of a one binding site system please see Supplementary Material Part 2). The single binding site model can be expanded for a two binding site system. We can expand Supplementary Material Equation 16.3 to allow for two independent binding classes:
In the above equation,
Building a theoretical model. To build the fetal bovine assay and human theoretical models, the concentrations of all the binding components in the fetal bovine assay and the human system were determined below. Table 1 displays the derived concentrations of albumin, AGP and FLAP in a bovine cell assay and in humans.
Table 1
Determining the total serum, albumin, AGP and FLAP concentrations in human physiological and bovine cell assay conditions
| Human physiological conditions | Bovine cell assay | |
| Total protein | 70 mg/mL (Range: 60–80 mg/ml) | 37.5 mg/ml |
| [Albumin], μM | 600 | 33.83 |
| [AGP], μM | 20.6 | 1.3 |
| [FLAP], μM | 388 | 0.18 |
| [FLAP] in bloodstream | 20.18 | |
| μM of FLAP per μM of albumin |
The concentrations of albumin and AGP can vary across individuals and in different disease states, such as cancer.
Total protein human and bovine protein levels. The calculations below are an estimate of protein concentrations. The absolute concentration of any individual depends on a number of factors within a range.
Human. The concentration of total human serum protein is between 60–80 mg/mL of blood [12]. If we take a midpoint of this range, we get 70 mg/mL of blood. The human serum albumin concentration is estimated to be
Bovine. Certification analysis provided with purchased fetal bovine serum (FBS) from Sigma-Aldrich states that the total protein for FBS is between 30–45 mg/mL. If we take the midpoint of this range, we get a value of 37.5 mg/mL. If we assume that 60% of the total serum protein is albumin, we get a concentration of
Fig. 2.
Difference CD spectra of FLAP binding to aqueous human (top left) and bovine (top right) fatty acid free serum albumins (concentration of HSAff and
![Difference CD spectra of FLAP binding to aqueous human (top left) and bovine (top right) fatty acid free serum albumins (concentration of HSAff and BSAff=500μM) and aqueous human (bottom left) and bovine (bottom right) alpha-1-acid glycoproteins (concentration of hAGP=20μM and bAGP=10μM). The difference CD spectra were calculated by subtracting from the FLAP: Protein [n:1] mixtures the spectra of albumin [4] and the [n] equivalents of FLAP alone. Inserts show the raw data as red points fitted to model curves (black trace) of CD data at single wavelengths versus FLAP concentration using a non-linear regression analysis model.](https://content.iospress.com:443/media/bsi/2017/6-1-2/bsi-6-1-2-bsi165/bsi-6-bsi165-g002.jpg)
3.Results
The binding affinities of BSAAff, HSAAff, bAGP and hAGP were determined using CD (Fig. 2), ITC (Fig. 3) and fluorescence titration spectroscopy (Fig. 4). Using circular dichroism, spectral changes caused by the binding of both BSAAff and HSAAff could be observed (see Fig. 2, Top Left and Right). In order to observe a large enough signal change in the BSAAff titration, a high concentration of the albumin was required, namely
Fig. 3.
ITC titrations of HSAAff (top left), BSAAff (top right) and bAGP (bottom right) with FLAP, respectively. Inserts give the raw data as red points fitted to a single binding site independent binding curve (black trace). The values obtained from the binding curves are given in the boxes. The red lines on the titrations are the raw injection data, which gives the experimental baseline from where the albumin and FLAP energies of injection were subtracted.
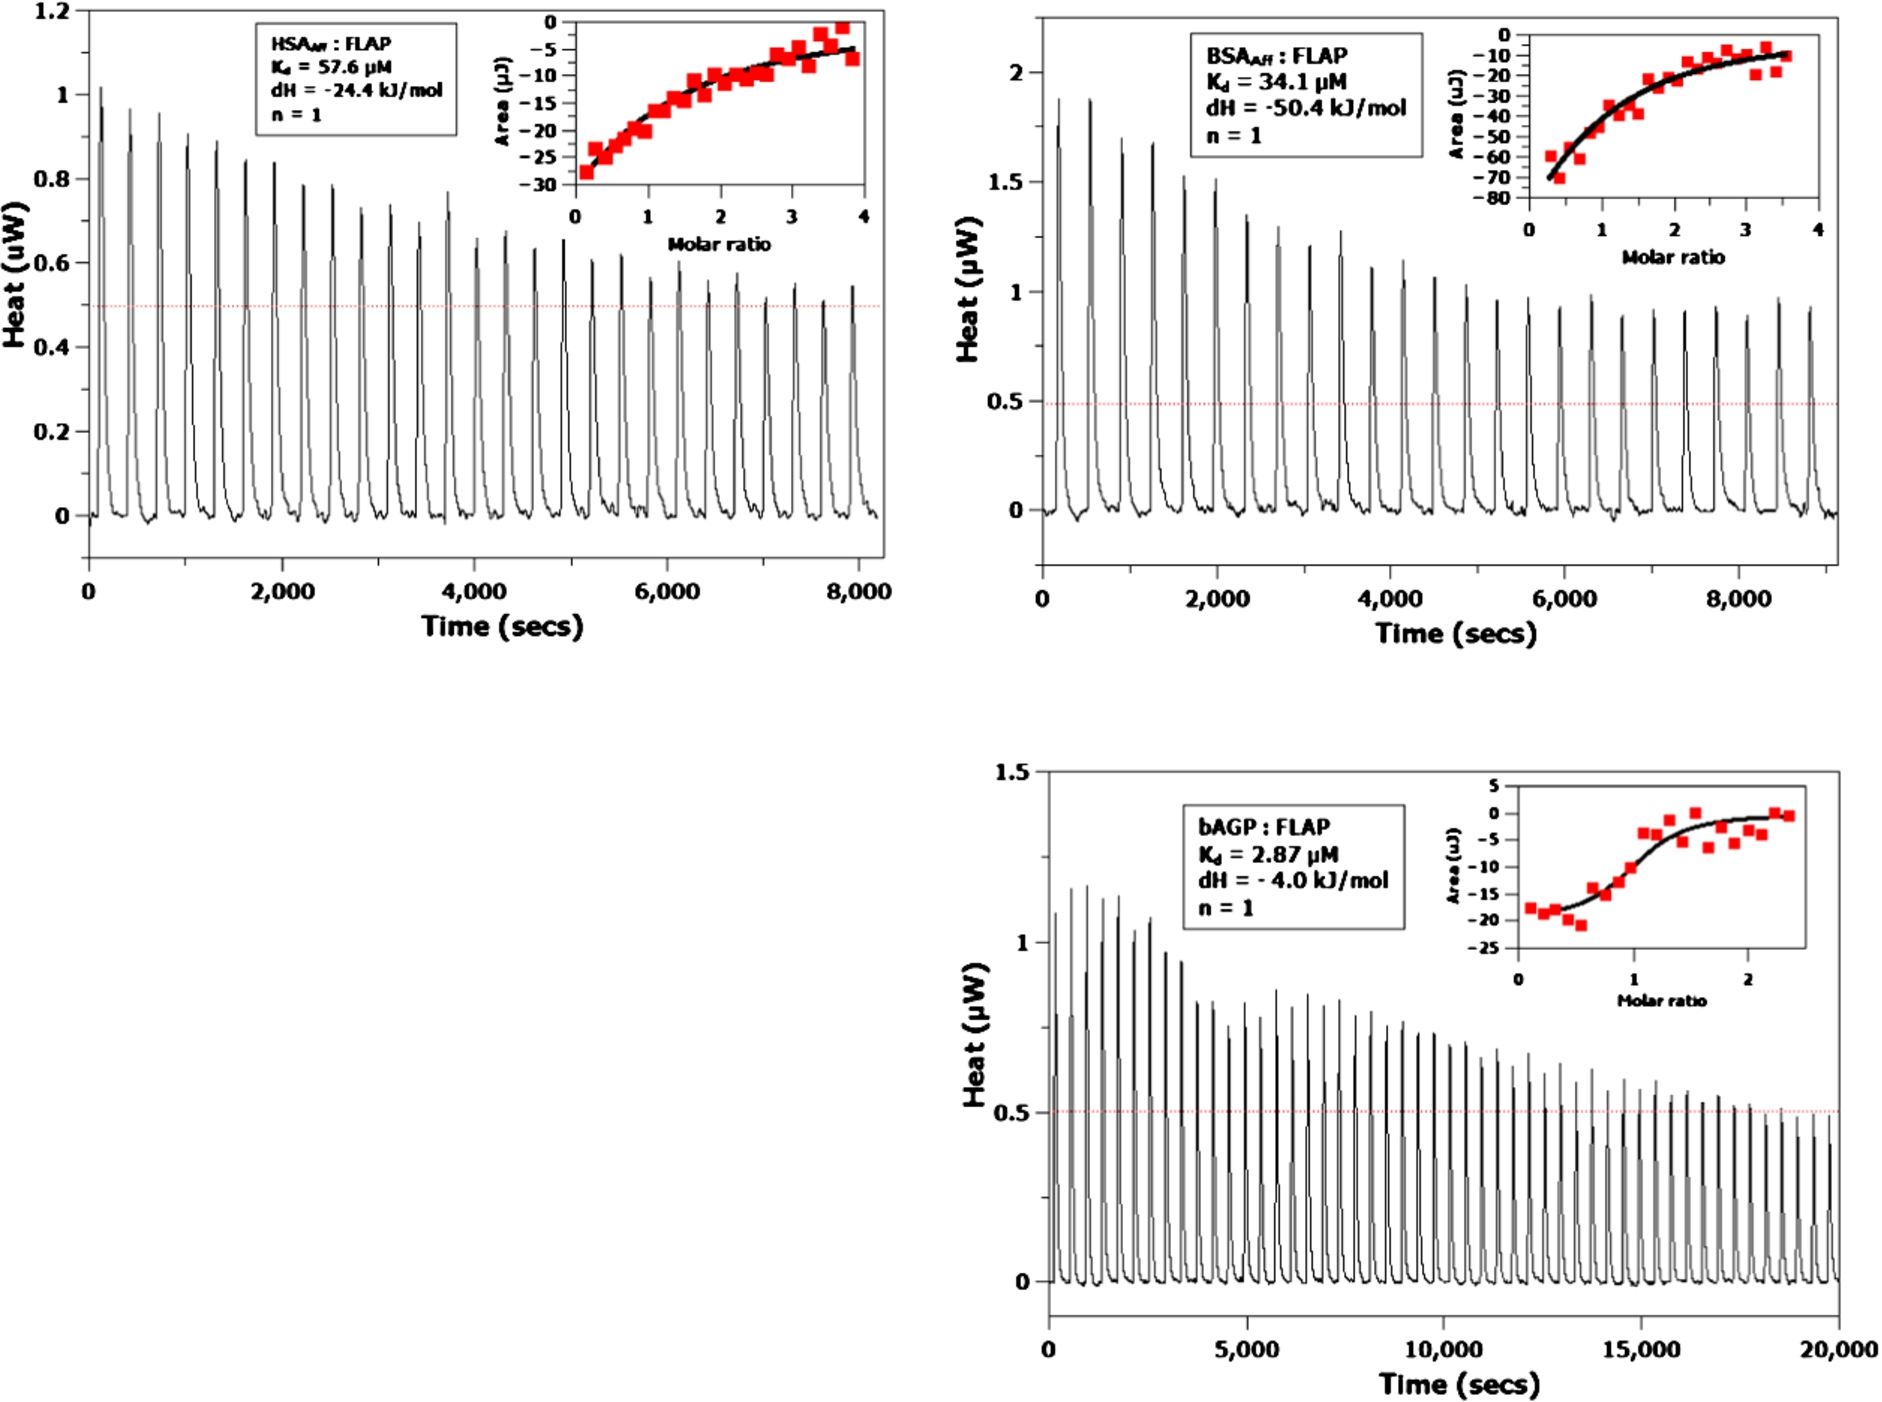
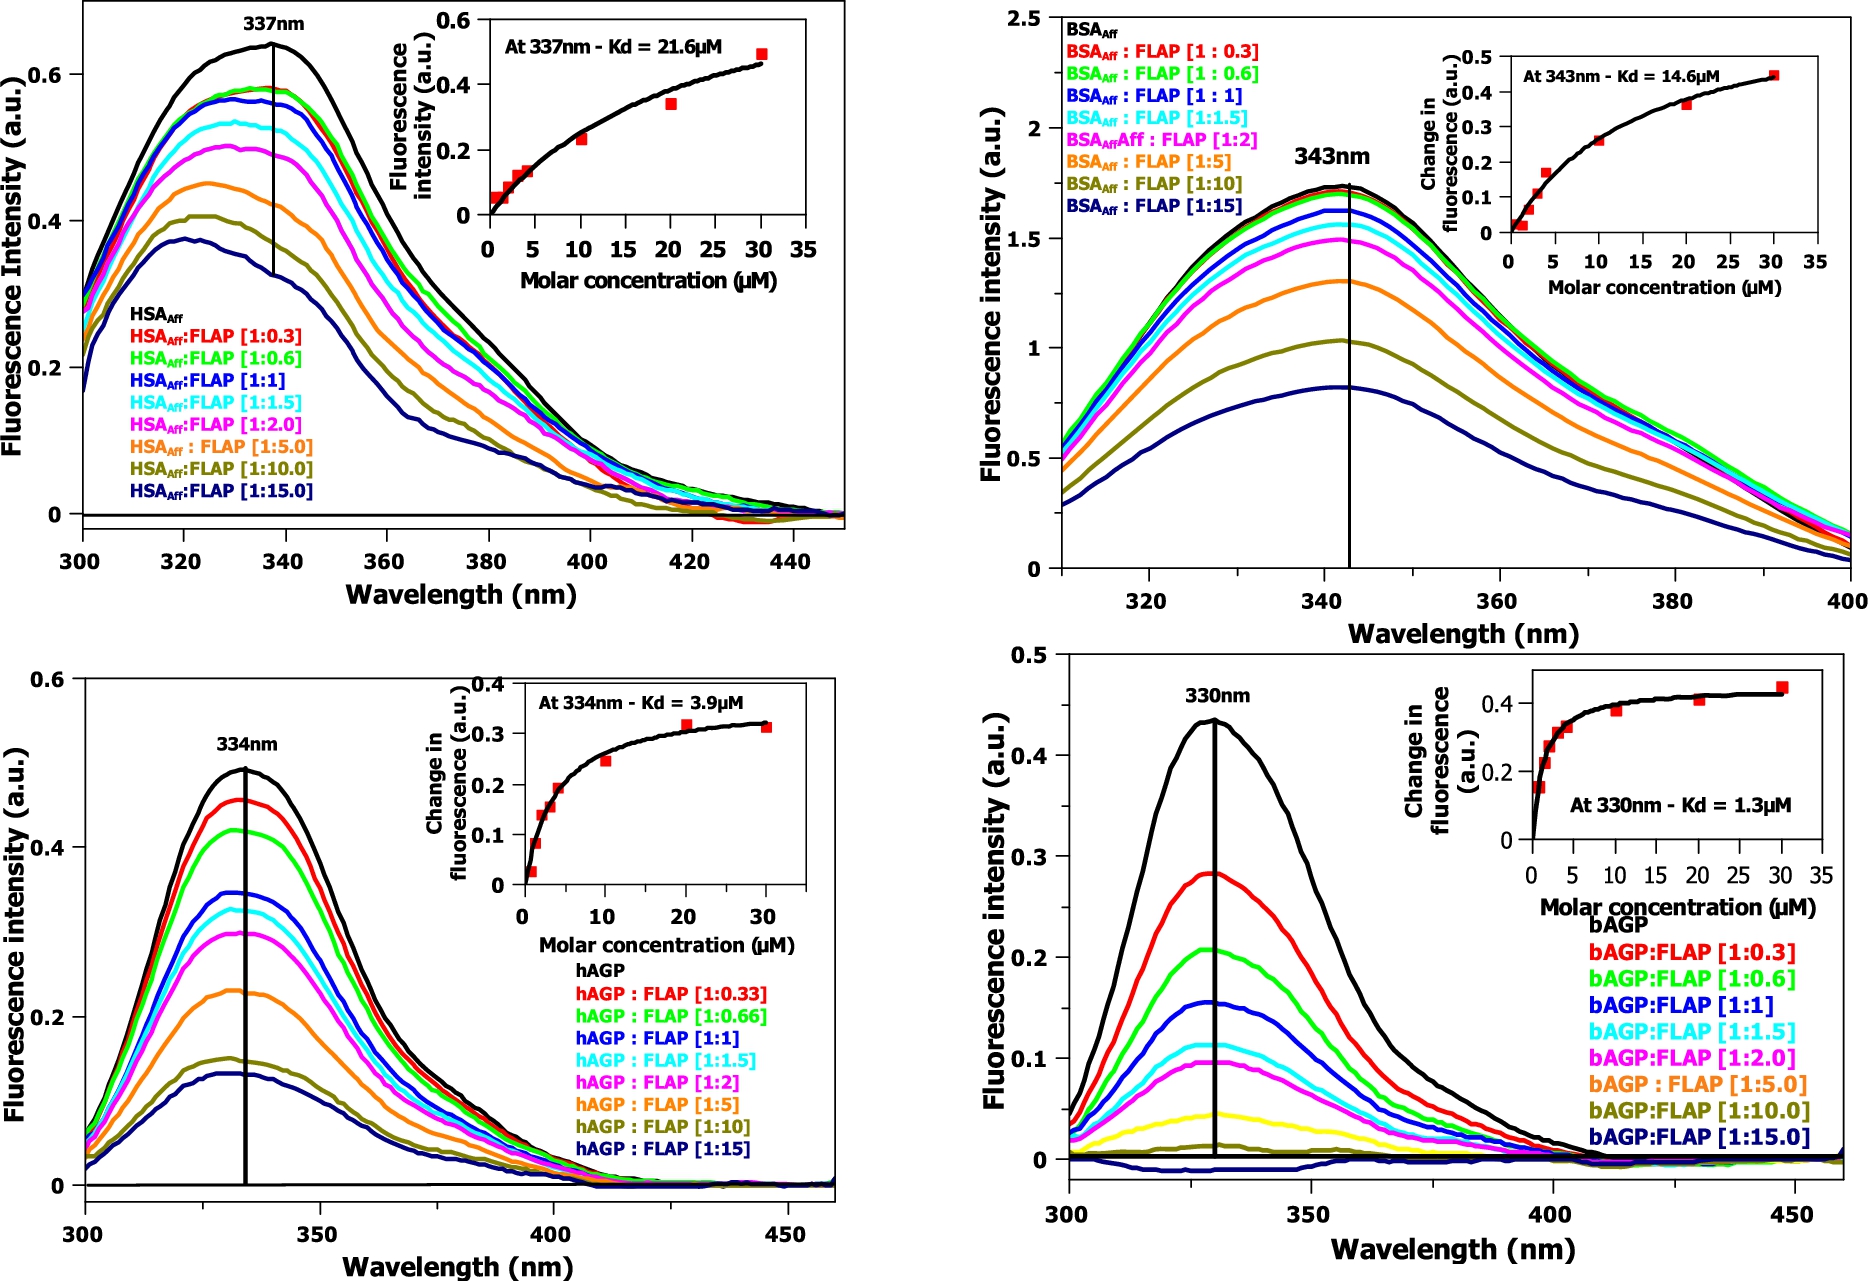
Fig. 4.
Fluorescence titration of FLAP with HSAAff (top left) and BSAAff (top right) and hAGP (bottom left) and bAGP (bottom right). Corrections of the excitation and emission light intensities of the albumin due to flavopiridol UV absorption have been made. Concentration of HSAAff, BSAAff, hAGP and
ITC titration experiments were performed on the BSAAff, HSAAff, bAGP and hAGP (see Fig. 3). Although only small exothermic signals were obtained, they were large enough to be modelled using an independent, one binding site model. Binding affinities of 57.6, 34.1 and
Fluorescence titration experiments (see Fig. 4) are similar in format to circular dichroism titrations. The data was fitted to a one binding site, non-linear regression model at a single, maximal wavelength (
Table 2
The binding affinity of FLAP to bovine and human blood serum albumin (fatty acid free) and alpha-1-acid glycoprotein (AGP)
| CD1 | ITC | Fluorescence3 | AUC4 | Used in Model | |
| Human Albumin (HSAAff) | Not determined – see results | Binding affinity ( | Binding affinity ( | 25 | |
| Human AGP | Binding affinity ( | N/A – due to aggregation at high AGP concentrations | Binding affinity ( | 1 | |
| Bovine Albumin (BSAAff) – AUC used BSAFA | Not determined – see results | Binding affinity ( | Binding affinity ( | Binding affinity ( | 25 |
| Bovine AGP | Binding affinity ( | Binding affinity ( | Binding affinity ( | 1 |
HSAAff, BSAAff, hAGP and bAGP model
1 The Chiˆ2/doF with 95% confidence level hAGP:
2 Range denoted in brackets show the binding affinities within a 95% confidence level.
3 The
4 The SEDFIT models fitted the experimental data with a high degree of accuracy, giving root mean standard deviations (RMSD) of
Table 3
Simulation of the percentage of bound FLAP, with different albumin binding affinities
| [Albumin], μM | [AGP], μM | Kd, AGP | Kd, Albumin | % FLAP bound | |
| Bovine cell assay, 2 binding site model | 33.83 | 1.3 | 1 | 10 | 82 |
| 25 | 72 | ||||
| 50 | 66 | ||||
| Human physiological Conditions, 2 binding site model | 600 | 20.6 | 1 | 10 | 99 |
| 25 | 97 | ||||
| 50 | 96 |
From the table, we can see that 72% of FLAP bound in the cell assay, compared to 98% in the human clinical trial. The human trial uses a bloodstream concentration of FLAP of
Fig. 5.
The model binding curves (bottom left and magnified top left and right) and model log binding curves (bottom right) for the binding models shown in Table 3. Fetal bovine serum cell assay (red trace) and human physiological conditions (black trace). The human and bovine cell assays use the albumin and AGP concentrations described in Table 1.
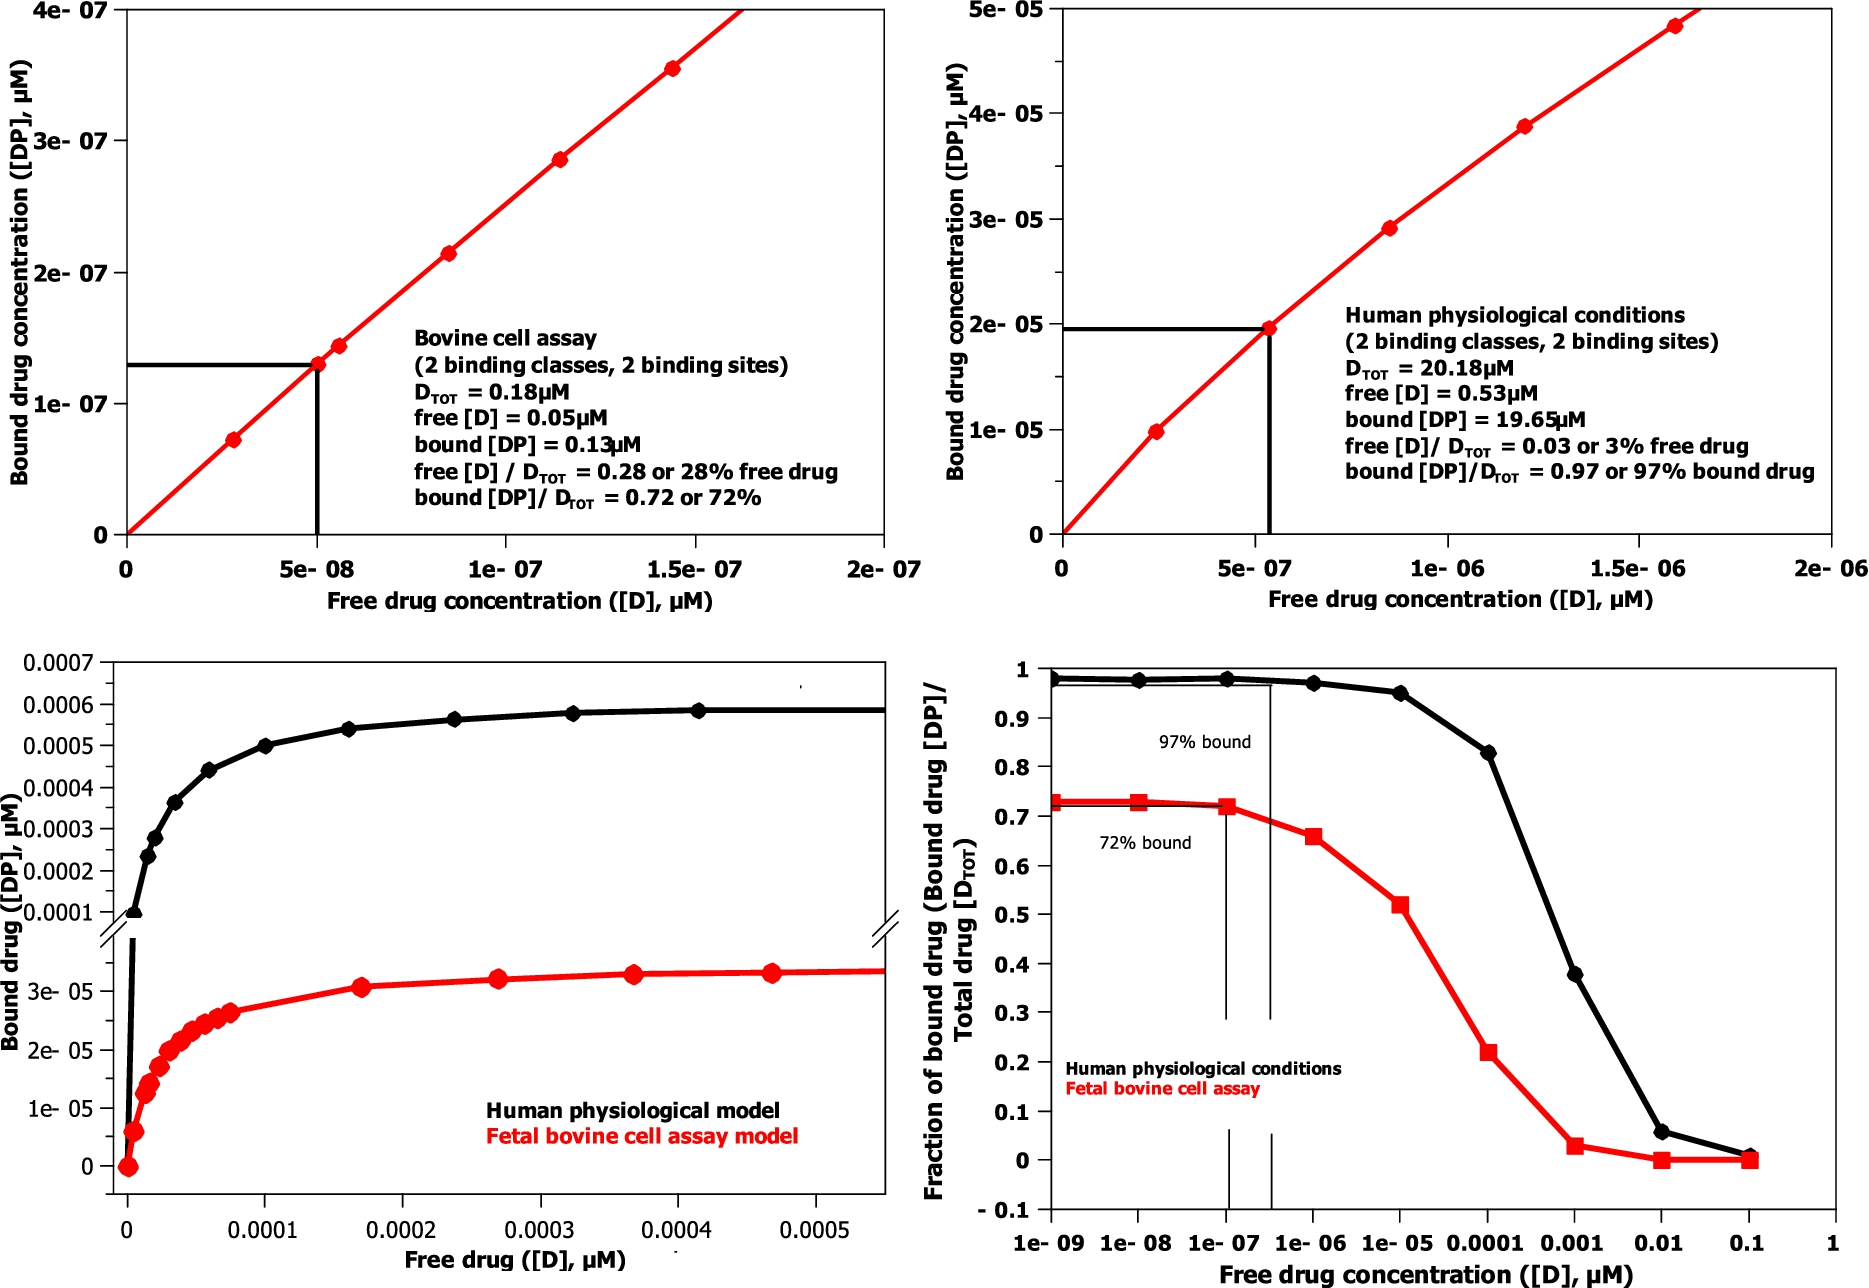
By determining the protein concentrations for a bovine cell assay and human physiological conditions (see Table 1,
AGP has a much larger initial effect on the amount of drug bound in the model, because its binding affinity is 25 times greater than albumin, when the drug level, as in both human and bovine cell assays, is comparable to or lower than the AGP concentration level (
Table 4
The free and bound concentrations of FLAP in the fetal bovine serum cell assay and human physiological conditions
| FLAP | Human assay (20180 nM) | Human assay (300 nM mean peak steady state Christian et al. [6]) | Bovine assay |
| Free, nM | 532.0 | 6.6 | 50.2 |
| Bound, nM | 19648.0 | 293.4 | 129.8 |
| [Total], nM | 20180.0 | 300.0 | 180.0 |
FLAP is a drug designed to treat CLL [3], but within the required dose calculation, little account has been taken of the albumin and AGP concentration changes that occur in a cancer patient. Cancer generally causes a 2–10 fold increase in AGP levels (even higher if the patient has undergone surgery) and a concomitant decrease in albumin levels to 70–80% of usual levels [10,12]. These serum protein concentration changes caused by cancer can be introduced to the model (see Table 5) and have a profound effect on the free and bound drug concentrations. From Table 5, we can see that a 10 fold increase in AGP concentration causes a 5 fold decrease in initial FLAP concentration levels, which is significant, while a 50% decrease in albumin levels has an approximate 1.6 fold increase in flavopiridol concentrations. As the first step to obtaining experimental data to validate the models produced, an AUC experiment was undertaken using BSAFA and FLAP (see Fig. 6). All components were recorded separately and then later in a 1:1 molar ratio. First, all components were visible by AUC, including flavopiridol (
Table 5
A table modeling the effect of changes in albumin and AGP concentrations, as seen in cancer, and how that affects the levels of free FLAP
| [AGP], μM | [Albumin], μM | Percentage Unbound, % | Unbound [FLAP], nM |
| 20.6 normal | 600 – 100% | 2.64 | 532 |
| 450 – 75% | 3.22 | 650 | |
| 300 – 50% | 4.21 | 850 | |
| 41.2 2-fold | 600 – 100% | 1.83 | 369 |
| 450 – 75% | 2.10 | 424 | |
| 300 – 50% | 2.49 | 502 | |
| 103 5-fold | 600 – 100% | 0.89 | 180 |
| 450 – 75% | 0.95 | 192 | |
| 300 – 50% | 1.02 | 205 | |
| 206 10-fold | 600 – 100% | 0.47 | 95 |
| 450 – 75% | 0.48 | 98 | |
| 300 – 50% | 0.50 | 101 |
Fig. 6.
Equilibria Analytical ultracentrifuge data of
![Equilibria Analytical ultracentrifuge data of 25μM FLAP (black), 25μM BSAFA (red) and a mixture of 25μM FLAP: 25μM BSAFA (green) in ddH2O. The sedimentation coefficient distribution was obtained by SEDFIT Analysis [9] of the absorbance data at 280 nm of a sedimentation velocity experiment at 129,024 g (RCF) and 20°C.](https://content.iospress.com:443/media/bsi/2017/6-1-2/bsi-6-1-2-bsi165/bsi-6-bsi165-g006.jpg)
Table 6
The location and area of the analytical centrifugation (AUC) peaks as shown on Fig. 6
| FLAP Location (S) | Percentage area | Local concentration (integrated area) | |
| FLAP | 0.13 | 0.99 | 0.96 |
| BSAFA monomer | 0 | 0 | 0 |
| BSAFA dimmer | 0 | 0 | 0 |
| Total | |||
| RMSD of model to theoretical data |
| BSAFA Location (S) | Percentage area | Local concentration (integrated area) | |
| FLAP | 0 | 0 | 0 |
| BSAFA monomer | 3.88 | 84.8 | 0.75 |
| BSAFA dimmer | 6.33 | 12.4 | 0.11 |
| Total | 97.2 | ||
| RMSD of model to theoretical data |
| BSAFA:FLAP Location (S) | Percentage area | Local concentration (integrated area) | |
| FLAP | 0.14 | 31.6 | 0.55 |
| BSAFA monomer | 4.34 | 55 | 0.96 |
| BSAFA dimmer | 6.59 | 9.9 | 0.17 |
| Total | 96.5 | ||
| RMSD of model to theoretical data | |||
| Free FLAP area / Total FLAP area | |||
| 1 binding site model with a |
The area of the free FLAP in the FLAP: BSAFA complex has been divided by the
4.Discussion
A number of conclusions can be drawn from this paper. First, flavopiridol does not bind to bovine or human albumin and AGP with an overly high binding affinity. In fact, the mid-range binding affinity (in the micromolar range) of both proteins may actually be beneficial for the drugs’ solubilisation and transport. As a result, further drug modification of flavopiridol, to reduce its binding affinity to albumin or AGP, would not be beneficial. Second, it is the free drug concentration, not the total drug concentration, that is routinely recorded in clinical papers, which is important for the drug’s efficacy at its target [11,15]. Third, although it does not make a significant difference in the case of flavopiridol, it is still common practice to use fetal bovine serum in cell assays in drug development for historical reasons. Species specific differential binding affinity, as seen with the drug ET-743, can be significant [1,19]. All cell assays should be performed with human serum, which is now commonly available and only slightly more expensive than fetal bovine serum. Fourth, due to flavopiridol’s poor clinical effect in human clinical trials, the dose schedule has now been modified and increased in concentration and duration [3]. While this methodology shows some response improvement, it has also brought about an increase in side effects due to greater toxicity levels. As stated previously, albumin and AGP levels may alter radically in disease states, including cancer. However, little account has previously been taken in accommodating these changes in patients. Measuring patient AGP and serum albumin concentrations, which is relatively easy to do in the clinic, would allow for individual modelling of a patient’s drug dose. The tailoring of a drug dose to individual patients would help produce maximal drug efficacy with minimal toxicity side effects. The model and protocol set out in this paper can be used with any drug or combination of drugs (commonly used in cancer treatment). This methodology may help better link clinical drug trials to experimental biochemical binding affinity data, becoming an integral part of drug development.
5.Future work
This paper is a first step toward combining experimentally determined binding affinities with theoretically determined binding models, to give insights into pre-clinical fetal bovine serum assays in comparison to human patients. This method can be further validated using different drug targets and complimentary experimental techniques such as ultrafiltration and equilibrium dialysis (LC-MS). Serum albumin and alpha-1-acid glycoprotein have been implicated in the binding of flavopiridol, although other proteins such as lipoproteins, immunoglobulins and erythrocytes could also be involved [16]. The theoretical models produced could also be expanded in the future to include these proteins.
Declarations of interest
The author declares that there are no competing interests with the manuscript.
Funding information
DPM was funded as a PDRA at Diamond Light Source Ltd. and then as a Biological Research Scientist at ISIS Neutron and Muon Source.
Acknowledgements
DPM performed the experiments and interpreted the data whilst a PDRA at Diamond Light Source Ltd. DPM then wrote the paper before and during his position at ISIS Spallation Neutron Source, Rutherford Appleton Laboratory, Harwell Science and Innovation Campus, Didcot, Oxfordshire, OX11 0QX, UK.
This paper is dedicated to the memory of Prof. Dame Louise Johnson (University of Oxford) who provided the authors first interest in flavopiridol. The author also wishes to thank Dr David Scott (University of Nottingham) for help running the AUC experiment and Dr Rohanah Hussain and Prof. Giuliano Siligardi (Diamond Light Source Ltd.) for helpful discussions. The author confirms that he has no conflict of interests.
References
[1] | J.H. Beumer, L. Lopez-Lazaro, J.H.M. Schellens, J.H. Beijnen and O. van Tellingen, Evaluation of human plasma protein binding of trabectedin (Yondelis, ET-743), Curr. Clin. Pharmacol. 4: ((2009) ), 38–42. doi:10.2174/157488409787236047. |
[2] | M.E. Burton, L. Shaw, J.J. Schentag and W. Evans, Chapter 6, in: Applied Pharmacokinetics and Pharmacodynamics: Principles of Therapeutic Drug Monitoring, Lippincott Williams and Wilkins, (2005) . |
[3] | J.C. Byrd, T.S. Lin, J.T. Dalton, D. Wu, M.A. Phelps, B. Fischer, M. Moran, K.A. Blum, B. Rovin, M. Brooker-McEldowney, S. Broering, L.J. Schaaf, A.J. Johnson, D.M. Lucas, N.A. Heerema, G. Lozanski, D.C. Young, J.R. Suarez, A.D. Colevas and M.R. Grever, Flavopiridol administered using a pharmacologically derived schedule is associated with marked clinical efficacy in refractory, genetically high-risk chronic lymphocytic leukemia, Blood 109: ((2007) ), 399–404. doi:10.1182/blood-2006-05-020735. |
[4] | J.C. Byrd, C. Shinn, J.K. Waselenko, E.J. Fuchs, T.A. Lehman, P.L. Nguyen, I.W. Flinn, L.F. Diehl, E. Sausville and M.R. Grever, Flavopiridol induces apoptosis in chronic lymphocytic leukemia cells via activation of caspase-3 without evidence of bcl-2 modulation or dependence on functional p53, Blood 92: ((1998) ), 3804–3816. |
[5] | G.W. Caldwell and Z. Yan, Isothermal titration calorimetry characterization of drug-binding energetics to blood proteins, in: Optim. Drug Discov, Z. Yan and G.W. Caldwell, eds, Humana Press, Totowa, NJ, (2004) , pp. 123–149. doi:10.1385/1-59259-800-5:123. |
[6] | B.A. Christian, M.R. Grever, J.C. Byrd and T.S. Lin, Flavopiridol in chronic lymphocytic leukemia: A concise review, Clin. Lymphoma Myeloma 9: (Suppl. 3) ((2009) ), S179–S185. doi:10.3816/CLM.2009.s.009. |
[7] | J. Dam and P. Schuck, Calculating sedimentation coefficient distributions by direct modeling of sedimentation velocity concentration profiles, Methods Enzymol. 384: ((2004) ), 185–212. doi:10.1016/S0076-6879(04)84012-6. |
[8] | J. Ghuman, P.A. Zunszain, I. Petitpas, A.A. Bhattacharya, M. Otagiri and S. Curry, Structural basis of the drug-binding specificity of human serum albumin, J. Mol. Biol. 353: ((2005) ), 38–52. doi:10.1016/j.jmb.2005.07.075. |
[9] | R. Hussain, K. Benning, D. Myatt, T. Javorfi, E. Longo, T.R. Rudd, B. Pulford and G. Siligardi, CDApps: integrated software for experimental planning and data processing at beamline B23, Diamond Light Source. Corrigendum, J. Synchrotron Radiat. 22: ((2015) ), 862. doi:10.1107/S1600577515007602. |
[10] | J.M. Kremer, J. Wilting and L.H. Janssen, Drug binding to human alpha-1-acid glycoprotein in health and disease, Pharmacol. Rev. 40: ((1988) ), 1–47. |
[11] | D. Myatt, L. Johnson, S. Baumli and G. Siligardi, The binding of flavopiridol to blood serum albumin, Chirality 22: (Suppl. 1) ((2010) ), E40–E43. doi:10.1002/chir.20925. |
[12] | T.J. Peters, All About Albumin, Academic Press, San Diego; New York [etc.], (1996) . |
[13] | M.A. Phelps, D.M. Rozewski, J.S. Johnston, K.L. Farley, K.A. Albanese, J.C. Byrd, T.S. Lin, M.R. Grever and J.T. Dalton, Development and validation of a sensitive liquid chromatography/mass spectrometry method for quantitation of flavopiridol in plasma enables accurate estimation of pharmacokinetic parameters with a clinically active dosing schedule, J. Chromatogr. B Anal. Technol. Biomed. Life Sci. 868: ((2008) ), 110–115. doi:10.1016/j.jchromb.2008.04.023. |
[14] | F.W. Putnam, The Plasma Proteins: Structure, Function, and Genetic Control, Vol. IV: , Academic Press, (1984) . |
[15] | G.K. Schwartz, E. O’Reilly, D. Ilson, L. Saltz, S. Sharma, W. Tong, P. Maslak, M. Stoltz, L. Eden, P. Perkins, S. Endres, J. Barazzoul, D. Spriggs and D. Kelsen, Phase I study of the cyclin-dependent kinase inhibitor flavopiridol in combination with paclitaxel in patients with advanced solid tumors, J. Clin. Oncol. Off. J. Am. Soc. Clin. Oncol. 20: ((2002) ), 2157–2170. doi:10.1200/JCO.2002.08.080. |
[16] | L. Shargel and A.B.C. Yu, Applied Biopharmaceutics & Pharmacokinetics, 7th edn, McGraw-Hill Education, New York, (2016) . |
[17] | G. Siligardi, B. Panaretou, P. Meyer, S. Singh, D.N. Woolfson, P.W. Piper, L.H. Pearl and C. Prodromou, Regulation of Hsp90 ATPase activity by the co-chaperone Cdc37p/p50cdc37, J. Biol. Chem. 277: ((2002) ), 20151–20159. doi:10.1074/jbc.M201287200. |
[18] | A.R. Tan, D. Headlee, R. Messmann, E.A. Sausville, S.G. Arbuck, A.J. Murgo, G. Melillo, S. Zhai, W.D. Figg, S.M. Swain and A.M. Senderowicz, Phase I clinical and pharmacokinetic study of flavopiridol administered as a daily 1-hour infusion in patients with advanced neoplasms, J. Clin. Oncol. Off. J. Am. Soc. Clin. Oncol. 20: ((2002) ), 4074–4082. doi:10.1200/JCO.2002.01.043. |
[19] | G. Tognon, R. Frapolli, M. Zaffaroni, E. Erba, M. Zucchetti, G.T. Faircloth and M. D’Incalci, Fetal bovine serum, but not human serum, inhibits the in vitro cytotoxicity of ET-743 (Yondelis, trabectedin), an example of potential problems for extrapolation of active drug concentrations from in vitro studies, Cancer Chemother. Pharmacol. 53: ((2004) ), 89–90. doi:10.1007/s00280-003-0704-y. |

