
Polarisation assessment in an intelligent argumentation system using fuzzy clustering algorithm for collaborative decision support
Abstract
We developed an on-line intelligent argumentation system which facilitates stakeholders in exchanging dialogues. It provides decision support by capturing stakeholders’ rationale through arguments. As part of the argumentation process, stakeholders tend to both polarise their opinions and form polarisation groups. The challenging issue of assessing argumentation polarisation had not been addressed in argumentation systems until recently. Arvapally, Liu, and Jiang [(2012), ‘Identification of Faction Groups and Leaders in Web-Based Intelligent Argumentation System for Collaborative Decision Support’, in Proceedings of International Conference on Collaborative Technologies and Systems] earlier developed a method to identify polarisation groups. These groups, however, tend to overlap to a certain degree; each stakeholder may be a member of multiple polarisation groups to varied degrees. Quantifying stakeholders’ membership in multiple polarisation groups is an important issue in the argumentation for collaborative decision-making, which is not addressed earlier. We present a novel approach using fuzzy clustering algorithm to address this issue in this article. The method is evaluated using data sets produced from the discussions of 24 stakeholders. Experimental results indicate that our method is effective for both identifying polarisation groups and quantifying stakeholders’ degree of membership in each polarisation group.
1. Introduction
Stakeholders in a decision-making group often undergo an argumentation process in a collaborative decision-making environment. In both group discussions and debates, stakeholders tend to form polarisation groups based on a similarity of their opinions (Latane 1981; Latane and Wolf 1981). Stakeholders with similar opinions tend to become closer by supporting one another. Additionally, they attack stakeholders with contrasting opinions. Polarisation groups are formed as a result. Arvapally, Liu, and Jiang (2012) have proposed an approach to identify polarisation groups in argumentation systems. Their approach computes aggregate opinion of stakeholders for each candidate solution of an issue and classifies stakeholders based on the similarity of their opinions (Arvapally et al. 2012). This framework was developed by assuming that a stakeholder belongs to a polarisation group. Stakeholders, however, might share opinions with multiple polarisation groups to varied degrees. Hence, polarisation groups may overlap to a certain degree. Identifying a stakeholder's membership in each polarisation group in argumentation is important since this piece of information will help consensus develop through negotiation and persuasion. This problem has not been previously addressed. We present a method based on fuzzy c-means clustering to resolve this issue.
The On-Line Intelligent Argumentation System (OLIAS) which we have developed allows stakeholders to post their decision issues and alternatives (Liu, Raorane, and Leu 2007; Liu, Khudkhudia, Wen, Sajja, and Leu 2009; Liu, Barnes, and Savolainen 2012). Stakeholders build an argumentation tree by exchanging arguments over the alternatives. The method presented in this article is implemented in the OLIAS to identify both polarisation groups and stakeholders’ memberships in multiple polarisation groups. This proposed method computes the aggregate opinion of a stakeholder over an issue across all alternatives. It uses the fuzzy c-means clustering algorithm (Bezdek 1981) to compare similarities between the opinions of stakeholders using Euclidean distance metric. A decision-maker would know to what extent a stakeholder is sharing his/her opinion with all the polarisation groups. This information allows a decision-maker to better understand the social dynamics among stakeholders and, thus make much more informed decisions.
The following example explains how the framework works in our OLIAS system. Suppose that a national financial policy is under discussion in the senate. Both senators and policy-makers use the OLIAS for collaborative decision support. These men and women belong to either political party A or political party B. These parties have contrasting opinions when selecting an alternative for the financial policy. Stakeholders in both parties A and B honour the decision taken by their respective party leaders on the policy. The stakeholders themselves, however, have their own opinions on the policy. These opinions may be in contrast to the party's interest. Our method can identify these polarisation groups, aggregate opinion of each polarisation group in the senate and membership of each stakeholder in the identified polarisation groups.
Each polarisation group has an aggregate opinion. Political party leaders can assess each senator's degree of membership based on his/her opinions. They can also assess the policy-makers in the same manner. The decision-maker can both analyse and understand differences between polarisation groups in terms of their opinions. Decision-makers can also identify the senator with the highest degree of membership in each polarisation group. In addition, the decision-maker can try to change minds of those senators whose memberships in their polarisation groups are low through persuasion and negotiation. Our method enables the leaders of both party A and party B to analyse not only the social dynamics among the stakeholders in their party, but also among the opposition party. The OLIAS can be used in any situation or organisation where a collaborative argumentation-based decision support is required.
In general, argumentation can be a tool for conflict resolution in many cases. Identification of memberships of stakeholders in polarisation may help identify stakeholders in multiple conflicting groups and resolve conflicts by changing their opinions through discussion process. Actually, it is observed in our experiments that on several occasions, participants change, strengthen or weaken their opinions based on their interactions with others in the dialogue process. Walton and Krabbe (1995) discussed the cascading effects during the dialogue process. They identified that cascading effects occur during shift in the dialogue process. The degree of membership of a stakeholder in polarisation groups is very dynamic. The membership scores help both decision-makers and other individuals to understand how strong a stakeholder is in a polarisation group.
The polarisation assessment which resulted in argumentation systems also helps stakeholders find other individuals who share similar interests and it also helps them connect with others. This is often referred to as ‘Finding their tribes’ in the literature (Klein 2012b). Our framework helps stakeholders in finding their tribes by providing the polarisation group information.
The next section in this article presents a detailed literature survey on polarisation assessment. The literature survey is followed by a brief presentation of the OLIAS. We then present the proposed method, and process of argumentation polarisation analysis followed by its evaluation.
2. Related works
This section presents a literature survey about the fuzzy polarisation assessment in the argumentation system. Polarisation widely exists in social systems. Section 2.1 presents and motivates the polarisation assessment problem from a social science aspect. Polarisation was analysed in social networks based on their social connections through community detection. Section 2.2 explains related community detection problems in social network research and presents how this problem is different from the polarisation assessment issue in argumentation systems. Section 2.3 discusses the literature of existing argumentation systems and found that none of them supports argumentation polarisation analysis. Section 2.4 concludes Section 2 by motivating the clustering algorithm used in our framework.
2.1. Polarisation assessment
Polarisation is a phenomenon in which people tend to form groups based on the similarity of the members’ opinions. Sunstein (1999) explained the phenomenon of polarisation as well as its association with both social cascades and social influence. Flache and Michael (2011), present polarisation as
A population that divides into a small number of factions with high internal consensus and sharp disagreement between them. A perfectly polarized population contains two opposing factions whose members agree on everything with each other and fully disagree on everything with the out-group.
Consolidation, clustering, correlation and continuing diversity are the four group-level phenomena (Latane and Wolf 1981; Latane 1996; Harton, Green, Jackson, and Latane 2000) that a group holds. Clustering here means the formation of polarisation groups within a discussion group. Stakeholders in a cluster are as close as possible and as dissimilar as possible from stakeholders in others. The dynamic social impact theory proposed by Latane (1996) presents three different principles:
(1) The social impact or the influence received by a target stakeholder in a group is because of the social forces.
(2) As the strength of the social forces increases, the influence also increases.
(3) When more stakeholders join the individual targeted stakeholder, the total influence received by this newly formed target group is diluted among the stakeholders in the group (Latane 1981).
Social influence is one of the reasons that stakeholders in a decision-making group both polarise and support one another. In his extended research, Latane identified polarisation groups as dynamic. They change throughout the discussion process as stakeholders change their opinions that quantify (Harton et al. 2000). This dynamic quality was an additional motivation for us to develop a method that quantifies a stakeholder's membership degree within each polarisation group. The dynamic social impact theory states that stakeholders form groups. These groups tend to polarise the stakeholders’ opinions.
The strength between social agents in a network also impacts social influence. Flache and Macy (2011) have conducted research based on Granovetter's (1973) theory of the strength of weak ties. The strength between social agents plays an important role in the formation of polarisation groups. Centola and Michael (2007) presented both the strengths and the weaknesses of long ties. Macy, Kitts, Flache, and Benard (2003) investigated the effect of polarisation in dynamic networks. They also investigated both the dynamics of influence and the attraction between agents in a dialogue process. Walton and Krabbe (1995) characterised dialogue into seven types. Persuasions, negotiation, inquiry, deliberation, information seeking, eristic and mixed are the seven different types of dialogues which are explored in the context of goals of stakeholders in a collaborative setting. The above-mentioned typology is the basis for interactions in groups.
Macy et al. (2003) discovered that the population self-organises into antagonistic groups in a social group. They claim that social agents are attracted to others within the same group. These agents become influenced by others with similar opinions. They are conditioned by both the strength and the valence of social ties. Social agents within the social network can self-organise into antagonistic factions without either the knowledge or intent of the social agents. Takacs (2005) analysed both the network segregation and the intergroup conflicts in a social group. Dense in-group and scarce out-group relations are known as segregation. Segregation in a social group supports the emergence of conflicts between polarisation groups (Takacs 2005). Simpson and Macy (2004) focused on the effects of social identity on the formation of coalitions in a social group.
According to Sillince (1995) and Sillince and Saeedi (1999), several important aspects of face-to-face meetings and discussions such as social, emotional and symbolic requirements, are missing in the current group decision support systems and computer-supported argumentation systems. Polarisation dynamics are part of the social dimension involved in face-to-face meetings and debates (Flache and Macy 2011). Klein (2012a, 2012b) identified the importance of identifying polarisation and balkanisation issues in computer-supported argumentation systems and other social media systems. Our effort is to incorporate this social dimension aspect into computer-supported collaborative argumentation systems. We are not aware of any other existing solutions for computing the degree of stakeholders’ membership within a polarisation group in the domain of computational argumentation.
2.2. Community detection in social networking
Since the advent of social networking sites in early 2000, many researchers have focused on different aspects of social networks. Several scientists have focused on problems such as community detection, information diffusion and more. The community detection problem (Newman 2004; Newman and Girvan 2004; Zhang, Wang, and Zhang 2007) differs from the polarisation assessment problem. Polarisation assessment focuses on how agents with similar opinions come together as a faction. Community is formed based on agents’ social connections.
Zhang et al. (2007) presented methods for identifying communities using both the K-means clustering algorithm (Forgy 1965; Macqueen 1967) and the fuzzy c-means clustering algorithm (Bezdek 1981). Du, Wu, Pei, Wang, and Xu (2007) presented a novel algorithm on the detection of communities in large-scale social networks.
Polarisation analysis discussed here occurs in argumentation systems, while the community detection problem occurs in social networks. Community detection approaches cannot be directly used for argumentation polarisation in argumentation systems since, network structure of argumentation system is different than social networks and community detection is based on social connections and argumentation polarisation is based on the similarity of participants’ opinions. The data collection and pre-processing process involved in the argumentation systems are different. Community detection problem is well investigated in social networks. The polarisation assessment problem, however, is yet to be explored.
2.3. Argumentation systems
Researchers developed many argumentation models and tools (Kunz and Rittel 1970; Conklin and Begeman 1988; Gordon and Karacapilidis 1997; Kraus, Sycara, and Evenchik 1998; Karacapilidis and Papadias 2001; Atkinson, Bench-Capon, and McBurney 2006; Karacapilidis et al. 2009; Vesic, Ianchuk, and Rubtsov 2012). We will review a list of examples of argumentation systems in the context of social interactions for collaborative decision support to make it relevant.
Many existing argumentation models follow either Dung's (1995) abstract model or Toulmin's (1958) informal argumentation model. Formal argumentation models are logically sound though difficult in practice to use. Informal argumentation models are easy to use in practice although they might be less logically sound.
Karacapilidis and Papadias (2001) developed the HERMES system. This system both supports argumentation discourse among stakeholders and works on the World Wide Web platform. It allows stakeholders to post their decision-making issues, candidate solutions and participate in the argumentation process by posting both their views and opinions. Each candidate solution is quantitatively assessed by the arguments that both support and attack that candidate solution. Based on the aggregate support and attack an argument receives, a label is assigned to each argument. This label signifies the status of an argument. The HERMES system detects both conflicts and consistencies in the arguments, and identifies a suitable candidate solution from the discourse.
Karacapilidis (2006), Karacapilidis et al. (2009), Tzagarakis, Gkotsis, Hatzitaskos, Karousos, and Karacapilidis (2009) and Tzagarakis et al. (2010) developed CoPe_it, a Web-based argumentation system for collaborative learning. CoPe_it allows stakeholders to participate in the argumentation process and thereby support discourse for knowledge sharing and building knowledge graphs. CoPe_it! supports weighing of arguments, and its weighing process is not based on either the notion of fuzzy logic concepts or probability. The decision-making features and capabilities in CoPe_it! can be further enhanced by making use of those weights provided by the agents in the dialogue.
PARMENIDES (Persuasive ARguMENt In DEmocracieS) (Atkinson et al. 2006) is a web-based argumentation system which encourages agents to post a position and justify a particular action and give them an opportunity to critique that position by disputing various points. This system allows several kinds of attacks and supports for persuasive argumentation. This system provides a form-based questionnaire to collect views from the stakeholders and builds an argumentation structure.
Vesic et al. (2012) recently developed the Synergy system to support argumentation-based decision-making. Synergy allows a stakeholder to post arguments supporting or attacking an option with a probability measure although no further specific use of them in argumentation computation is reported (Vesic et al. 2012). This system might be used as a basis of a reference system for pros and cons, just as one might use Wikipedia to collect thoughts on issues. The researchers here need to present how goals, arguments and options are defined.
Argument mapping systems such as Debatepedia (http://idebate.org/debatabase), TruthMapping (http://www.truthmapping.com/), DebateGraph (http://debategraph.org) and LivingVote (http://www.livingvote.org/) provide primitive discussion services. Several of them do not support scoring or weighing arguments quantitatively.
Social and emotional aspects of argumentation including argumentation polarisation, which do exist in face-to-face meetings and debates, need to be incorporated in computer-supported argumentation systems. Existing systems do not support these features although Klein (2012b) presented several deliberation metrics of argumentation which are related to social interactions (Sillince 1995; Sillince and Saeedi 1999; Klein 2012a). Balkanization and dysfunctional argumentation presented in the works of Klein (2010, 2012) are related to polarisation. While Klein (2012b) identifies the importance of polarisation problem, he does not discuss any method of detection of polarisation groups and how they are implemented in the Deliberatorium in his papers (Klein 2010, 2012a, 2012b).
Arvapally et al. (2012) proposed an approach to identify polarisation groups in argumentation systems. Their approach classifies stakeholders using K-means clustering algorithm (Arvapally et al. 2012). Their method assumes that stakeholders are non-overlapping and generates the results.
2.4. Clustering algorithms
Clustering algorithms can be broadly classified as exclusive clustering, overlapping clustering, hierarchical clustering and probabilistic clustering algorithms. Exclusive clustering algorithms such as K-means can be used, but they produce only crisp results. Hierarchical clustering would be more appropriate if we wanted to analyse the intra-group polarisation assessment. The probabilistic clustering methods such as Gaussian mixture model, if used for the argumentation polarisation analysis in our system, would identify membership of stakeholders in polarisation groups with probability. However, a degree of membership of stakeholders in polarisation groups is more desirable in assessing their memberships in the argumentation polarisation analysis. We would like to have a stakeholders’ degree of membership in a polarisation group, not the probability of being in a group. Hence, fuzzy-based clustering algorithms seem to be more appropriate. Models such as the latent semantic analysis (Deerwester, Dumais, Furnas, Landauer, and Harshman 1990), the probabilistic latent semantic analysis (Hofmann 2001) or the Latent Dirichlet Allocation (Blei, Ng, and Jordan 2003) are more appropriate if used in the clustering textual argument analysis. The K-means clustering algorithm was used earlier (Arvapally et al. 2012) to identify non-overlapping polarisation groups. Overlapping clustering algorithms such as fuzzy c-means are more suitable and output more social dynamic information than hard clustering algorithms.
3. On-line intelligent argumentation system
3.1. Elements of an argumentation tree
In our previous research work, we developed an OLIAS on the World Wide Web platform. Below is a brief discussion of its building blocks for a better understanding. For more information, please refer to our previous papers on the system (Liu et al. 2007, 2009, 2012).
This sub-section presents the elements of an argumentation tree in our OLIAS.
Project: Project node is at the first level of the argumentation tree where the project name and other information such as the stakeholder who posted the project are posted. Any stakeholder can post a project, and under the node project, and any number of relevant and concerned issues of that project can be posted.
Issue: Issue node is at the second level in the argumentation where a stakeholder can post concerned decision-making issues under the project node. Positions or alternative solutions are posted under the issue in the argumentation tree. A decision-making group can participate in several decision-making issues related to a project. The decision issues we are discussing here are very strategic and are of high importance to an organisation. These issues are usually cognitively complex. The results from these decisions affect several others financially and economically.
Position: Since the alternatives allow the stakeholders to explore the solution space through interactions, any number of positions can be posted under an issue. Arguments are either directly or indirectly associated with a position node. Position or alternatives are the two keywords which are used interchangeably in this article.
Argument: Every argument carries a strength which expresses its association with its parent node. Stakeholders are also responsible for posting argument strength explicitly along with the argument and the argument strength ranges from −1 to +1. A negative strength conveys that the argument is attacking its parent argument, an argument with positive strength conveys that the argument is supporting its parent node, and an argument with strength zero expresses its indecisiveness. Stakeholders can strengthen their arguments by posting evidence which support their arguments (Liu et al., 2007, 2009, 2012). The dialogues exchanged by stakeholders in the argumentation process are for deliberation, persuasion and negotiation.
Evidence: The OLIAS allows the stakeholders to post evidence supporting their arguments. Evidence can be attached to arguments posted by others and any number of pieces of evidence can be posted.
In Figure 1, E1 and E2 represent the pieces of evidence posted by stakeholders supporting arguments in the argumentation tree. The weight assigned to evidence represents the degree of confidence that the participant has in the evidence or in the probability of the evidence holding true (Liu, Khudkhudia, and Leu 2008). For example, evidence E1 has been assigned 0.9 and 0.1. This signifies that the owner of that evidence has 0.9 probability score for the evidence holding true and 0.1 for the evidence holding false. The weight value of evidence is used to reassess the strength of the argument using evidence-based fuzzy inference engine (Liu et al. 2008).
Figure 1.
Position dialogue graph.
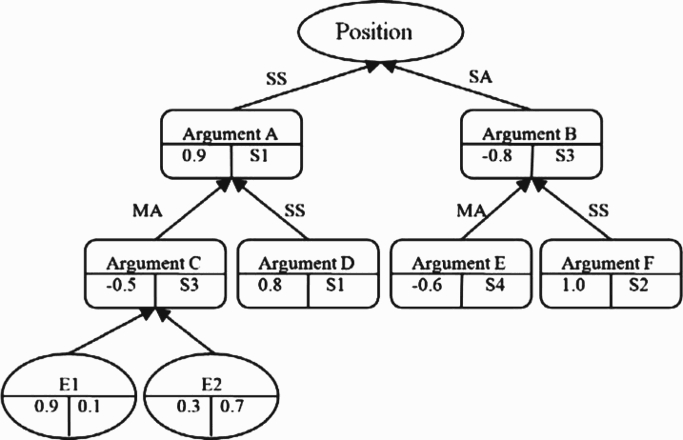
Figure 1 presents an example of a position dialogue graph and it illustrates example arguments in a position dialogue graph. Based on the strength of the argument, the system identifies labels such as medium support, strong support, indecisive, medium attack and strong attack. The labels are linguistic terms whose semantics are captured by their membership functions. The degree of strength of an argument posted by their owners will be used for fuzzy inference by the fuzzy inference engine based on fuzzy inference rules using the labels.
Before the argumentation process, stakeholders initially have an idea and an opinion towards the decision problem. As the argumentation process unfolds, they get to know the opinions and views of other stakeholders. In the process, stakeholders also have the opportunity to express their arguments on other individual's arguments. Contrasting opinions lead to conflicts and resolving conflicts lead to refining the opinions of stakeholders. At the end of the process, consensus will be developed among stakeholders. This exchange of information in groups leads to collective decision-making. Please see our article (Liu, Wanchoo, and Arvapally 2011) to know more about the opinions and goals of stakeholders in an argumentation process.
The OLIAS supports multiple scenarios in the collaborative decision-making environment. A decision-making group is led by the decision-maker who also participates in the argumentation process along with other stakeholders. In another context, all stakeholders collectively participate in the argumentation process, and take decisions effectively.
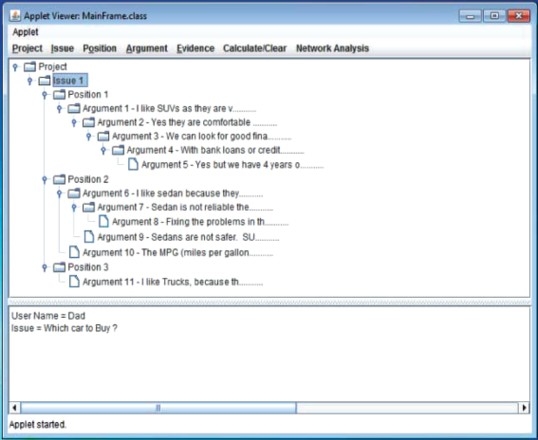
Figure 2 presents a snapshot of an example argumentation tree in the OLIAS. The following sub-section presents a detailed discussion about the argumentation reduction fuzzy inference system in an argumentation tree.
Figure 2.
Snapshot of argumentation tree in the OLIAS.
3.2. Fuzzy argumentation reduction inference engine
The fuzzy argumentation reduction inference system (Liu et al. 2007, 2009) carries out the inference process on an argumentation tree. This process is carried out on all the arguments in a tree. Arguments are reduced level by level such that all the arguments are directly associated with their respective alternatives. The favourability factor of an alternative is then computed by using the argument strengths. Both the strength of an argument and the strength of its parent argument are provided as inputs to the fuzzy inference engine. Child argument and parent argument are put on the same level of an argumentation tree based on the inference. The child argument is reduced by one level in the tree such that both arguments are siblings, providing a new strength value which is relative to its parent argument.
Based on the 4 fuzzy heuristic rules, 25 fuzzy rules were derived based on fuzzy labels. These 25 rules in the fuzzy rule base are used by the fuzzy inference engine argumentation reduction (Liu et al. 2007, 2009). The following four are the fuzzy argumentation reduction heuristic rules (Liu et al. 2007, 2009).
If argument B supports argument A and argument A supports position P, then argument B supports position P.
If argument B attacks argument A and argument A supports position P, then argument B attacks position P.
If argument B supports argument A and argument A attacks position P, then argument B attacks position P.
If argument B attacks argument A and argument A attacks position P, then argument B supports position P.
The argumentation reduction fuzzy inference system takes strengths of an argument that has to be reduced and its parent argument as inputs. Based on the fuzzy membership functions, these strength values undergo fuzzification process. The output from the fuzzification process is given as input to the fuzzy inference engine, and appropriate fuzzy rules are applied from the fuzzy rule base for inference. Based on the rules, a relative strength value is derived with respect to its parent argument. This new score undergoes the defuzzification process. In the defuzzification process, the obtained inputs are converted to crisp outputs. For further information on the fuzzy argumentation inference system, please read our articles (Liu et al. 2007, 2009).
After the argumentation reduction process, the favourability of alternatives is computed by aggregating the argument strengths associated with an alternative. The favourability factor produced by the system for each alternative represents the favourability of the decision-making group for that alternative. The higher the favourability factor of an alternative is, the more favourable it is to the group. It is computed based on the fuzzy argumentation reduction inference engine.
4. Framework for fuzzy argumentation polarisation analysis
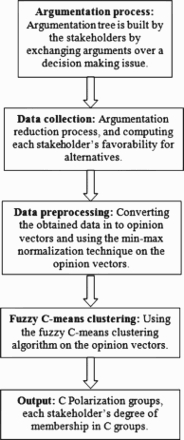
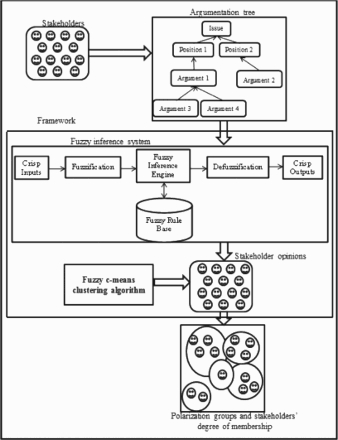
Stakeholders in a decision-making group participate in the argumentation process using the OLIAS. They build an argumentation tree by exchanging arguments. The argumentation reduction fuzzy inference engine derives each stakeholder's favourability towards a solution alternative. The obtained data is normalised using a min–max normalisation technique. These data are represented as a vector and provided as input to the fuzzy c-means clustering algorithm. This algorithm outputs, c polarisation groups. This method is illustrated in Figure 3. The following sub-sections discuss each step in detail.
Figure 3.
Framework for fuzzy-based polarization assessment.
4.1. Argumentation process
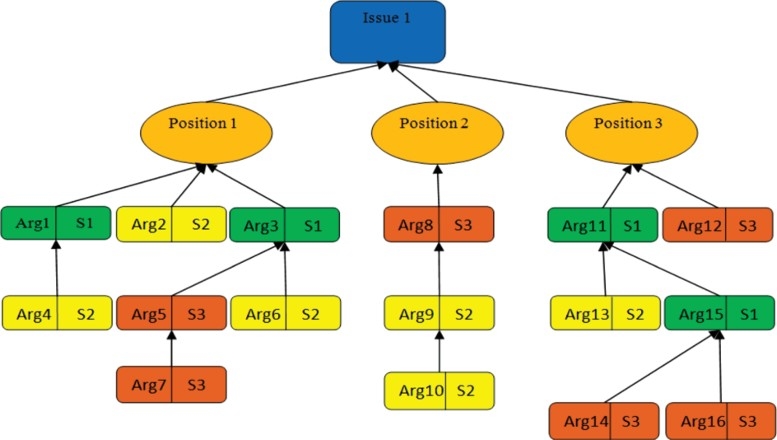
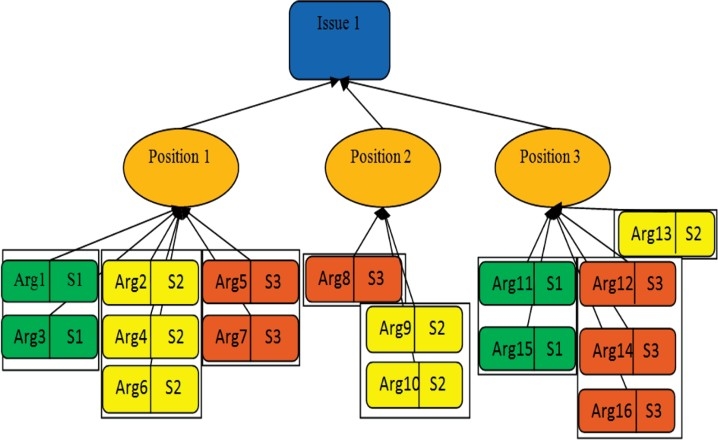
This is the first step in the framework, stakeholders undergo a dialogue process here. Figure 4 presents a sample argumentation tree. Figure 4 illustrates both a decision-making issue (root node) and three positions, i.e. alternatives posted under the issue node. Sixteen arguments posted by three different stakeholders are listed under position 1, position 2 and position 3. S1, S2, S3 represent the three participating stakeholders. Arg1, Arg2, Arg3 are some of the arguments in the sample argumentation tree. Each stakeholder's arguments are represented in a different colour.
Figure 4.
Sample argumentation tree before the argumentation inference process.
4.2. Data collection
After the argumentation process, the framework runs argumentation reduction fuzzy inference engine on the argumentation tree to compute a stakeholder's favourability for an alternative. In Figure 4, stakeholder S2 has contributed three arguments under position 1. While one argument is directly associated with position 1, and the other two are associated with the arguments posted by stakeholder S1.
The fuzzy inference rules presented in Section 3.3 were used for the argumentation reduction process. The association between (Arg1, position 1) and (Arg4, Arg1) is considered for using the appropriate fuzzy inference rules. Based on the suitable fuzzy rule, the Arg4 is reduced level by level such that it is directly associated with position 1. The same procedure was conducted for Arg6. The system ensures that all arguments posted by a stakeholder are directly associated with an argument. The argumentation-based fuzzy inference system then reassesses the strengths of the arguments based on the inference rules. The new strength that an argument is assigned is relative to the solution alternative.
Once all arguments are directly associated with the alternatives, the strengths of the arguments posted by a stakeholder under every alternative are aggregated. Hence, the favourability of a stakeholder towards every alternative is derived. This process is conducted for the stakeholders at every position posted in the tree. The favourability of a stakeholder is represented by a numerical value. This value is the sum of the arguments’ strength of a stakeholder for a position.
See Figure 5 for the argumentation tree after the fuzzy inference process. The favourability of stakeholder S2 for position 1 is the aggregate of the argument's strength: Arg4, Arg2 and Arg6 (Figure 5). Similarly, the favourability of stakeholder S2 for positions 2 and 3 is derived. If the favourability value of a stakeholder for a position is negative, the stakeholder has more attack than support for his/her arguments for that position. If the favourability of a stakeholder for a position is positive, the stakeholder has more support than attack for the position.
Figure 5.
Argumentation tree after the argumentation inference process.
If the favourability factor of a stakeholder for a position is zero, the stakeholder is neutral in opinion about the position. Because the aggregate of both support and attack of the argument's strength is neutralised. In another case, stakeholders may not have posted any arguments under that position in the tree. Following the argumentation process, the argumentation system computes the favourability of each stakeholder for all the positions in the argumentation tree.
All stakeholders are encouraged to participate in the dialogue process, but if stakeholders do not present his/her complete opinions on given issues, the argumentation polarisation analysis might help detect missing opinions since the degree of stakeholders in polarisation groups from the clustering analysis might be different from their expectations, and prompt stakeholders to address the issue by adding their opinions. Of course, the polarisation analysis itself cannot solve the problem of missing opinions completely since it is not a problem of the argumentation polarisation analysis.
In the data collection phase, we acquire data from an argumentation tree, while data pre-processing phase consists of different tasks such as cleaning the data, handling missing data and normalising the data to make the data consistent (Wirth 2000).
4.3. Data pre-processing
The opinion of a stakeholder is represented as a vector after the favourability of a stakeholder for each alternative is derived. Each element in the vector represents the favourability for a position. The number of positions under an issue in an argumentation tree represents the size of the vector. The vectors are normalised to retain consistency in the data.
The min–max normalisation technique (Equation (1)) is used to normalise the elements in the vector. We refer to these vectors as opinion vectors because each vector represents a stakeholder's opinion towards the given issue. Min A and max A represent the minimum and the maximum values in the original data, respectively. New_min A and new_max A represent the new ranges for the data provided. In our experiments, we have assigned new_min A as −1 and new_max A to +1 as the new ranges. The stakeholder's favourability for an alternative is represented with numerical values ranging from −1 to +1. An element in the opinion vector between −0.1 and −1.0 signifies that the stakeholder attacks an alternative. Values between +0.1 and +1.0 signify that the stakeholder supports an alternative. After the data is normalised, the fuzzy c-means clustering algorithm is used on the opinion vectors.
4.4. Fuzzy c-means clustering
This sub-section briefly presents on how the fuzzy c-means clustering algorithm is used in our approach. After the system computes the favourability of each stakeholder across all the positions, the fuzzy c-means algorithm is applied on those favourability vectors. Because each stakeholder's opinion is represented as a vector, we have the opportunity to both compare and assess how close stakeholders’ opinions are. Let us suppose stakeholder S3 is one among the decision-making group, and there are three different positions for the decision-making issue in the argumentation tree. S3 has presented his opinion across all three positions. The favourability factor of S3 is represented as (0.9, −0.2, 0.5). This signals that S3 is supporting position 1 and position 3 and weakly attacking position 2.
The fuzzy-based clustering algorithm outputs the clusters, providing each stakeholder's membership in c clusters. The fuzzy c-means clustering algorithm produces c number of clusters from the given data. The algorithm tries to minimise the objective function over several iterations. When the objective function value remains unchanged, it produces the clusters. The algorithm provides the centroid of each cluster.
Fuzzy c-means clustering algorithm works by assigning each data point to each cluster based on the distance between the cluster centroid and the data point. The closer the data point is to the cluster centroid, the higher its membership is in that cluster. The fuzzy c-means clustering algorithm is based on minimising its following objective function (Equation (2)).
S and c are provided as inputs to the algorithm and the algorithm produces membership of each data point in multiple clusters as output.
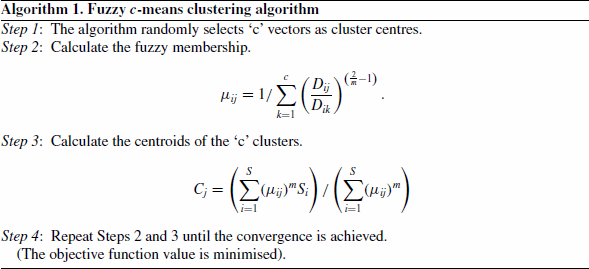
We used the Euclidean distance metric (Equation (3)) to assess the similarity measurement among stakeholders’ opinions in the fuzzy c-means clustering algorithm.
4.5. Cluster analysis for polarisation assessment
The centroid of a cluster is a vector. This vector represents the aggregate opinion of a polarisation group. The centroid of each polarisation group can be further used to analyse the dissimilarity between polarisation groups using the Euclidean distance as a measurement metric. When analysing polarisation groups, we may encounter groups with completely contrasting opinions. In some cases, we might also see groups with similar opinions. Some groups might share similar opinions or contrasting opinions with respect to a particular alternative. These polarisation groups tend to form factions, supporting stakeholders within their group. They tend to attack stakeholders in the opposing group, using both their arguments and evidences supporting their arguments. Stakeholders might even use arguments to support their arguments. The degree of membership of a stakeholder in a group can help both the decision-maker and group leaders understand the loyal stakeholders/followers within his/her polarisation group. It also allows for further investigation on new approaches to identify leaders in each polarisation group. A stakeholder from each polarisation group with the highest degree of membership can be acknowledged as the group leader.
In some cases, a stakeholder might absolutely belong to a polarisation group. In another instance, a stakeholder might have an equal degree of membership in two different polarisation groups. This information might help polarisation leaders in pursuing each stakeholder based on stakeholders’ interest and thereby providing incentives to them. One can also arrange stakeholders in ascending or descending order based on the stakeholders’ degree of membership and generate a ranked list. Therefore, each polarisation group has a ranked list of stakeholders based on the membership value. The decision-maker can also generate top-k list from the ranked list. One could further investigate the overlapping of the ranks of a stakeholder in the multiple polarisation groups. A stakeholder might have the same rank in two or more polarisation groups.
5. Process of argumentation polarisation analysis
This section explains the process of the polarisation analysis method in the argumentation. Each phase in the process is presented in Figure 6. Initially, a decision-maker from a group of stakeholders in an organisation posts a decision-making issue and alternatives in the OLIAS. During the discussion process, a stakeholder selects an argument or a position in the argumentation tree and then posts his own argument under the selected argument. Stakeholders are responsible to post the strength of the argument along with their arguments.
Figure 6.
The process of argumentation polarisation analysis.
Once an argumentation tree is built, the decision-maker runs the framework on the argumentation tree. The opinions of the stakeholders are derived using the argumentation reduction fuzzy inference system, see Figure 6.
After deriving the opinions, the framework runs the fuzzy c-means clustering algorithm on the opinions using the c value provided by the decision-maker. The framework then produces c polarisation groups, and each stakeholder's degree of membership in all c polarisation groups. In Figure 6, we can see the polarisation groups identified by the framework and one can understand that the groups are overlapping to a certain extent.
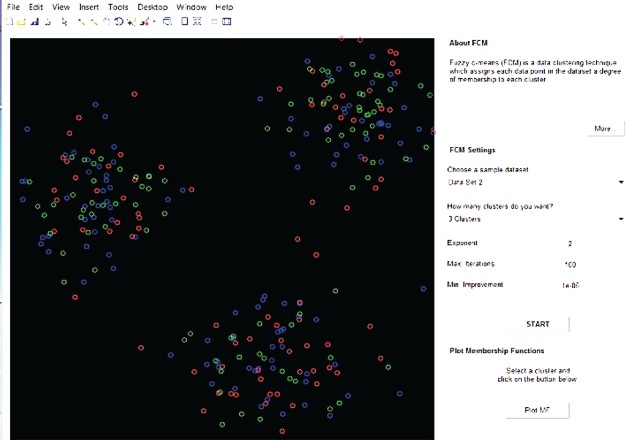
The decision-maker now has the results, using which he can know the opinion of each and every stakeholder and their degree of membership in all polarisation groups. Figure 7 presents a snapshot of fuzzy c-means clustering programme interface.
Figure 7.
A fuzzy c-means clustering programme interface.
5.1. Example
This sub-section presents a small and simple example to illustrate the framework we presented in detail. Suppose that a family plans to buy a new car and selecting a car model is an important decision-making issue in the family. The family consists of 11 members including grandfather, grandmother, father, mother and kids. Let us use the OLIAS for collaborative decision support to resolve the issue in hypothetic scenarios. Initially, the family members post the issue and their solution alternatives in the argumentation tree and the family members exchange arguments over the issue. The decision issue and solution alternatives (positions) are presented as follows:
Issue: Buying a new car for our family.
Position 1: Sports Utility Vehicle (SUV).
Position 2: Sedan.
Position 3: Truck.
Step 1: The stakeholders in the decision-making group carry out their discussions and debate over SUV, sedan and truck by posting their opinions and viewpoints in the form of arguments and build an argumentation tree.
Step 2: After the argumentation process, the framework collects the opinion vector data from the tree using the argumentation reduction fuzzy inference process. The opinions of stakeholders towards each position can be found in Table 1.
Step 3: This step deals with data pre-processing. Each value in Table 1 represents the favourability of a stakeholder towards a car model. The opinion vectors are normalised. The opinions of stakeholders in Table 1 are hypothetical values. Each family member in the decision-making group is represented as stakeholder Sn (
Step 4: Fuzzy c-means clustering algorithm is employed on the opinion vectors in Table 1 by providing c value as an input. Since we provided c=2, the framework outputs two polarisation groups. Along with the polarisation group information, the degree of membership of each stakeholder in both the groups is also produced. The centroid of a polarisation group represents the opinion of that group. Table 2 presents the opinions of the polarisation groups and the stakeholders in each group.
Step 5: Analysing and understanding the results produced. In this step, it is the responsibility of the decision-makers and other stakeholders to understand and analyse the results produced by the framework. Group 1 consisted of five stakeholders who support Sedan but oppose the positions SUV and Truck. Group 2 consisted of six stakeholders who support SUV and Truck but oppose the position Sedan.
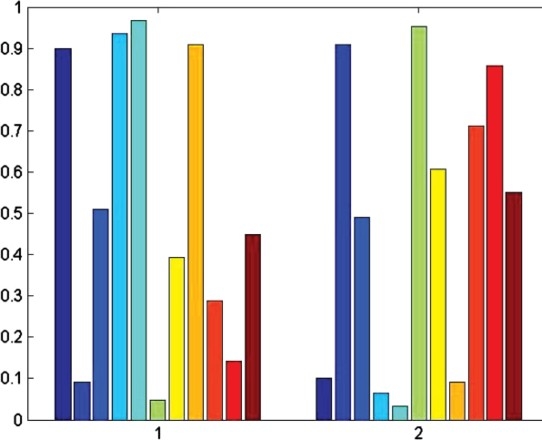
Table 3 presents the degree of membership of all stakeholders in both polarisation group 1 and group 2. Stakeholder S5 is sharing his opinion with group 1 with a degree of 0.9669 and is strongly associated with group 1. While stakeholder S11 has a degree of membership 0.4495 in group 1 and 0.5505 in group 2, though he belongs to group 2, he is also affiliated with group 1 with a good membership score.
Table 1.
Opinions of the stakeholders towards the given decision issue.
| Stakeholder Id | SUV | Sedan | Truck |
| S1 | −0.9 | 0.8 | −0.9 |
| S2 | 0.6 | −0.9 | 0.7 |
| S3 | 0.7 | 0.8 | 0.5 |
| S4 | −0.4 | 0.7 | −0.1 |
| S5 | −0.5 | 0.9 | −0.6 |
| S6 | 0.4 | −1.0 | 0.3 |
| S7 | −0.4 | −0.8 | −0.7 |
| S8 | −0.1 | 0.5 | −0.9 |
| S9 | 1 | −1 | −1 |
| S10 | 0.1 | −0.2 | 0.2 |
| S11 | −0.3 | 0.2 | 0.8 |
Table 2.
Opinions of polarisation group 1 and group 2.
| Opinions | SUV | Sedan | Truck | Stakeholders |
| Polarisation group 1 | −0.3537 | 0.6088 | −0.4806 | S1, S3, S4, S5, S8 |
| Polarisation group 2 | 0.3467 | −0.5962 | 0.1478 | S2, S6, S7, S9, S10, S11 |
Table 3.
Degree of membership of all stakeholders in both polarisation group 1 and group 2.
| Polarisation groups | S1 | S2 | S3 | S4 | S5 | S6 | S7 | S8 | S9 | S10 | S11 |
| Degree of membership in polarisation group 1 | 0.9001 | 0.0915 | 0.5104 | 0.9367 | 0.9669 | 0.0478 | 0.3931 | 0.9084 | 0.2891 | 0.1429 | 0.4495 |
| Degree of membership in polarisation group 2 | 0.0999 | 0.9085 | 0.4896 | 0.0633 | 0.0331 | 0.9522 | 0.6069 | 0.0916 | 0.7109 | 0.8571 | 0.5505 |
Figure 8 presents the values of Table 3 in a histogram. This simple example is provided to understand the process of the argumentation polarisation analysis. A scalable example with complicated decision issues can be illustrated in the OLIAS for argumentation polarisation analysis.
Figure 8.
Degree of membership of stakeholders in group 1 and group 2.
6. Evaluation
6.1. Background
To evaluate the effectiveness of our proposed framework, we conducted three experiments on a case study (Satyavolu 2010). We recruited 24 students from a software engineering class at Missouri University of Science and Technology. A hypothetical case study was developed and provided to students before the experiment began. This case study was the common platform for all three experiments. Students played the role of stakeholders in the experiments. Each experiment in our evaluation had a decision-making issue pertaining to the case study and the 24 stakeholders resolve the issues using our argumentation system. Data collected from our experiments are from the stakeholders. A demonstration was given to the students on how to use the argumentation system. A user manual was also provided. The experiment was conducted for one month. The stakeholders were provided with the access to our OLIAS. We provided the decision-making group with one week for each decision-making issue. Initially, we ran the experiment with different c values, such as c=2, 3, 4, 5, 6, 7. The objective function scores for c=2 and c=3 were much higher than c=4, 5, 6 and 7. Before the experiment began, gave out a survey to those 24 stakeholders in order to know their initial opinions on the given decision-making issue. We realised that there were four major opinions among the stakeholders. This motivated us to consider c value as 4. However, by using root mean square error as a criterion, one can try different c values. In this article, we present experiment I in detail and discuss the overview of experiment II and experiment III.
6.2. Case study
The adoption of a software metrics programme for a software project development is useful in organisations. Identifying the suitable metrics programme for a given project is both important and difficult as it depends on various factors, such as the size of the organisation, the size of the project and many more. In several situations, an organisation finds difficulty in identifying the most suitable metrics programme. In our case study, we provided a software product to be developed. The stakeholders use our argumentation system to decide the suitable metrics programme in large-scale organisation, medium-scale organisation and small-scale organisation in experiments I, II and III, respectively. We provided stakeholders with concrete information about the software development project in the case study. We also explained the positions in detail. Comprehensive metrics programme, light-weight metrics programme and no metrics programme are the three positions provided to all the three issues. In no metrics programme, organisations do not adopt any software metrics programme, fewer than 35% of the artefacts are measured using a light-weight metrics programme and from 35% to 60% of the artefacts are measured in the comprehensive metrics programme. Since the decisions issues are built up on the common case study, these three positions were the same to all three decision issues. The students’ names were replaced with stakeholder identification numbers to preserve the privacy of the participating students. The following two example arguments were posted by stakeholders under the first decision-making issue. These arguments were posted under the comprehensive metrics programme and light-weight metrics, respectively.
Since the organization develops mission critical software and software assurance is a major criterion, the most suitable and efficient metrics program would be the comprehensive metrics program as it leads to developing a product of high quality.
There may be situations where the large organization will have to handle small or medium sized projects. In such situations the organization cannot invest a large portion of its revenue on a comprehensive metrics program. Considering the size of the project and the number of employees and deliverables a light-weight metrics program would be best suitable.
Alternatives (Positions).
Position 1: Comprehensive metrics programme.
Position 2: Light-weight metrics programme.
Position 3: No metrics programme.
We provided stakeholders with some criteria in order to motivate them to participate in the argumentation process: customer satisfaction, quality, cost, volatility of requirements were some of them. Stakeholders, however, can also consider other relevant criteria.
6.3. Experiment I
Stakeholders participated in the argumentation process for selecting the suitable software metrics programme for software development in a large organisation. Stakeholders exchanged 204 arguments for one week using our system. The proposed method was then applied on the argumentation tree with c=4 as input. The fuzzy c-means algorithm has run for 32 iterations by minimising the objective function score. The framework identified four polarisation groups and presented each stakeholder's degree of membership in four polarisation groups. After 32 iterations, the fuzzy c-means clustering algorithm had stopped and thereby producing the polarisation groups as output. Figure 9 presents a plot where the objective function values are plotted against the iteration count. Table 4 presents the centroids (opinions) of each polarisation group, and stakeholders in each group produced by the method. Table 5 presents the membership of each stakeholder in the four polarisation groups.
Figure 9.
Objective function values plotted against the iteration count.
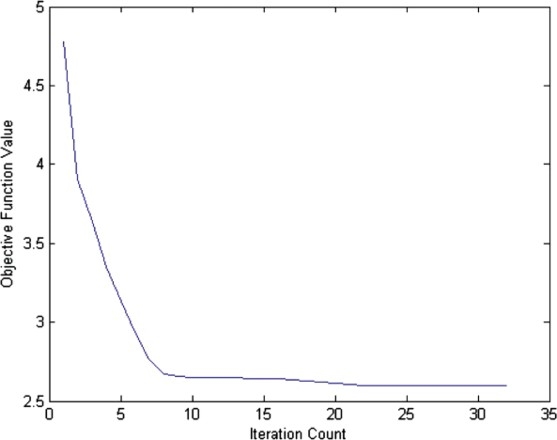
Table 4.
Four polarisation groups identified by our framework in Experiment I.
| Polarisation groups | Comprehensive metrics programme | Light-weight metrics programme | No metrics programme | Stakeholders |
| Group 1 | −0.3176 | 0.7687 | 0.3881 | S4, S18, S21, S23 |
| Group 2 | 0.5022 | −0.0841 | −0.6036 | S6, S7, S8, S12, S14, S24 |
| Group 3 | 0.7129 | 0.0220 | −0.3222 | S1, S2, S3, S5, S10, S11, S13, S15, S16, S22 |
| Group 4 | −0.3665 | −0.5872 | −0.2860 | S9, S17, S19, S20 |
Table 5.
Each stakeholder's degree of membership in all four polarisation groups.
| Stakeholders | Polarisation group 1 | Polarisation group 2 | Polarisation group 3 | Polarisation group 4 |
| S1 | 0.003718 | 0.080492 | 0.910671 | 0.005118 |
| S2 | 0.021965 | 0.261014 | 0.686536 | 0.030485 |
| S3 | 0.00132 | 0.016425 | 0.980567 | 0.001687 |
| S4 | 0.367586 | 0.202437 | 0.188603 | 0.241374 |
| S5 | 0.033895 | 0.263294 | 0.643013 | 0.059798 |
| S6 | 0.010391 | 0.821822 | 0.149782 | 0.018005 |
| S7 | 0.072309 | 0.475887 | 0.323848 | 0.127956 |
| S8 | 0.023642 | 0.742382 | 0.167901 | 0.066075 |
| S9 | 0.064793 | 0.346609 | 0.188301 | 0.400297 |
| S10 | 0.005732 | 0.052765 | 0.934514 | 0.006989 |
| S11 | 0.002985 | 0.031865 | 0.961423 | 0.003727 |
| S12 | 0.028761 | 0.639512 | 0.28445 | 0.047277 |
| S13 | 0.079695 | 0.294606 | 0.532597 | 0.093102 |
| S14 | 0.019747 | 0.479735 | 0.454579 | 0.045939 |
| S15 | 0.012211 | 0.4535 | 0.516165 | 0.018125 |
| S16 | 0.026053 | 0.257002 | 0.684736 | 0.03221 |
| S17 | 0.211625 | 0.153088 | 0.156209 | 0.479078 |
| S18 | 0.642739 | 0.100943 | 0.106787 | 0.149532 |
| S19 | 0.084737 | 0.125322 | 0.096394 | 0.693547 |
| S20 | 0.018217 | 0.049499 | 0.035057 | 0.897227 |
| S21 | 0.975055 | 0.00813 | 0.008987 | 0.007827 |
| S22 | 0.00132 | 0.016425 | 0.980567 | 0.001687 |
| S23 | 0.742631 | 0.087334 | 0.109836 | 0.060199 |
| S24 | 0.001358 | 0.966495 | 0.029186 | 0.002961 |
Group 1 consisted of four stakeholders who attacked the comprehensive metrics programme, strongly supported the light-weight metrics programme and weakly supported the no metrics programme. Group 2 consisted of six stakeholders who supported the comprehensive metrics programme, attacked the light weight and no metrics programme. The opinions of the polarisation group 1 and group 2 were contrasting and they were like two different factions. Group 3 consisted of 10 stakeholders who strongly supported the comprehensive metrics programme, weakly supported the light-weight metrics programme and attacked the no metrics programme. The opinion of the stakeholders in group 3 was contrasting with the opinion of the stakeholders in group 1 and group 2 under different positions. The 10 stakeholders in group 3 shared similar opinions with group 2 under the context of the comprehensive metrics and no metrics programme. They, however, had contrasting opinions under the context of light-weight metrics programme. Group 1 stakeholders had a similar opinion with stakeholders in group 3 under the context of the light-weight metrics programme. Groups 1 and 3 had contrasting opinions with respect to the other two positions. The four stakeholders from group 4 attacked all three alternatives.
Figure 10(a) presents the opinion vectors of the 24 stakeholders that were plotted in a three-dimensional co-ordinate system with position 1, position 2 and position 3 as the axis. We have three positions for the issue and the opinion vector consists of three elements. Hence, we have a three-dimensional figure. Position 1, position 2 and position 3 refer to comprehensive metrics programme, light-weight metrics programme and no metrics programme, respectively, in Figures 10(a) and 10(b). Figure 10(b) presents the opinion data of the 24 stakeholders that were plotted after the framework was applied to the collected data. Each polarisation group is represented in a different colour and a different symbol. These plots also provide more insight on the polarisation groups.
Figure 10.
(a) Opinion vectors of stakeholders plotted in three-dimensional space before polarisation assessment. (b) Polarisation groups identified by the method (best viewed in colour).
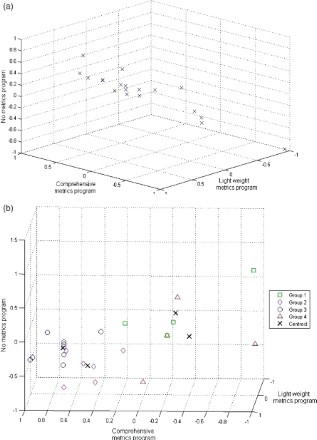
Table 5 presents the degree of membership of the stakeholders in all four polarisation groups. For example, stakeholder S9 had a membership of 0.064793 in group 1, 0.346609 in group 2, 0.188301 in group 3 and 0.400297 in group 4. S9 had the highest membership in group 4 when compared with the degree of membership with other groups. S9 belonged to all the polarisation groups; however, S9 had highest membership with group 4.
Polarisation group 1 and group 2 had contrasting opinions, stakeholders S4, S18, S21 and S23 were from group 1 and had a contrasting opinion with the stakeholders S6, S7, S8, S12, S14 and S24 in group 2. Stakeholder S4 belonged to group 1 and shared opinion with group 1 with a degree of membership of 0.367586, and 0.202437 with group 2. We understand that although S4 is from group 1, shared opinion with group 2 to a degree of 0.202437. Another interesting example from Table 5 is stakeholder S14 who shared the same opinion as group 2 with a degree of 0.479735 and 0.454579 with group 3. The membership values of S14 for groups 2 and 3 were very close. Stakeholders from group 3 or the polarisation leader from group 3 can possibly pursue S14 to join their polarisation group and extend S14s’ support. One can also understand that S14 belongs to group 2; however S14 also had a strong affinity for group 3 as well. At the same time, stakeholder S24 belongs to group 2, S24 had a membership of 0.966495 in group 2 and 0.001358 in group 1. We can conclude that S24 strongly belonged to group 2 compared with S4 who weakly belongs to group 1 and group 2.
Figure 11 presents the membership plot of the 24 stakeholders in the decision-making group. Every stakeholder has membership values for polarisation groups. The highest membership value of a stakeholder among all his/her membership values is presented in Figure 11. Some stakeholders such as S3, S10, S11, S21, S22 and S24 strongly belong to a polarisation group and they have a weak degree of membership with other polarisation groups. The rest of the stakeholders have relatively lower membership values in a polarisation group, and they actually share opinion and belong to other polarisation groups to a good degree of membership.
Figure 11.
Each stakeholder's highest degree of membership among all his memberships in polarisation groups.
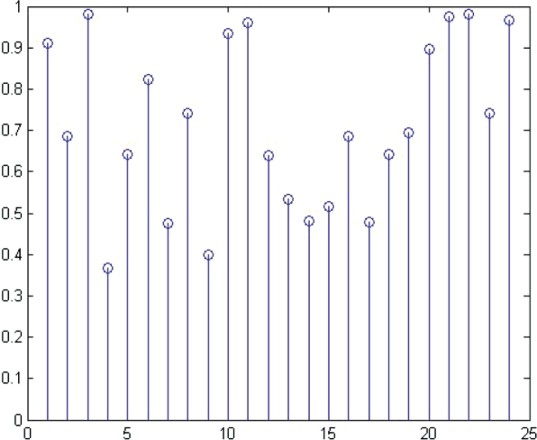
Table 6 presents the opinion dissimilarity measurement of the polarisation groups. Since the centroid of each polarisation group is the opinion of that group, the Euclidean distance metric is used to measure the dissimilarity of the opinion of the polarisation groups. Information from Table 6 explains the closeness among the polarisation groups in terms of opinion for the given decision-making issue. The larger the distance value between polarisation groups, the more dissimilar the polarisation groups are under their opinion for the given decision-making issue. For example, stakeholders from group 3 may pursue stakeholders in group 2 and converge to one group, since group 2 and group 3 are close in terms of their opinion.
Table 6.
Dissimilarity measurement among the polarisation groups.
| Group 1 | Group 2 | Group 3 | Group 4 | |
| Group 1 | 0 | 1.5436 | 1.4574 | 1.5150 |
| Group 2 | 1.5436 | 0 | 0.3672 | 1.0529 |
| Group 3 | 1.4574 | 0.3672 | 0 | 1.2399 |
| Group 4 | 1.5150 | 1.0529 | 1.2399 | 0 |
Based on the membership value of a stakeholder in each polarisation group, stakeholders are ranked. Table 7 presents the stakeholders ranked list in the descending order for all the polarisation groups. The ranked list is arranged from top to bottom in the descending order. Stakeholder S21 in polarisation group 1 had the highest membership value in group 1, and S22 had the lowest membership value in group 1. Stakeholder S21 is ranked number one in polarisation group 1; however S21 is ranked last in group 2 and group 3. A decision-maker can correlate the opinion of each polarisation group and the ranked list presented in Table 7 for more information on social dynamics in the decision-making group.
Table 7.
Ranked list of stakeholders based on their degree of membership.
| Polarisation group 1 | Polarisation group 2 | Polarisation group 3 | Polarisation group 4 |
| S21 | S24 | S3 | S20 |
| S23 | S6 | S22 | S19 |
| S18 | S8 | S11 | S17 |
| S4 | S12 | S10 | S9 |
| S17 | S14 | S1 | S4 |
| S19 | S7 | S2 | S18 |
| S13 | S15 | S16 | S7 |
| S7 | S9 | S5 | S13 |
| S9 | S13 | S13 | S8 |
| S5 | S5 | S15 | S23 |
| S12 | S2 | S14 | S5 |
| S16 | S16 | S7 | S12 |
| S8 | S4 | S12 | S14 |
| S2 | S17 | S4 | S16 |
| S14 | S19 | S9 | S2 |
| S20 | S18 | S8 | S15 |
| S15 | S23 | S17 | S6 |
| S6 | S1 | S6 | S21 |
| S10 | S10 | S23 | S10 |
| S1 | S20 | S18 | S1 |
| S11 | S11 | S19 | S11 |
| S24 | S3 | S20 | S24 |
| S3 | S22 | S24 | S3 |
| S22 | S21 | S21 | S22 |
By further analysing the information from Table 7, one can generate the top-k list of stakeholders from each polarisation group based on the degree of membership. This information can be used to identify the top-k stakeholders who have the highest degree of membership with each polarisation group. We have assumed k value as 4 since we used c as 4 earlier in running the experiment. Although there is no association between the variables c and k, we could also generate the top-6 stakeholders from each polarisation group. The framework can even generate the bottom k stakeholders from each polarisation group. One can even use the information from Table 8 for identifying the polarisation leader in each group. A polarisation group leader is a stakeholder from a polarisation group who leads a group. We could assign the stakeholder with highest degree of membership as a leader of that group.
Table 8.
Top-k lists of stakeholders from each group based on their rank from the ranked list.
| Polarisation groups | Top-k stakeholders in the group |
| Polarisation group 1 | S21, S23, S18, S4 |
| Polarisation group 2 | S24, S6, S8, S12 |
| Polarisation group 3 | S3, S22, S11, S10 |
| Polarisation group 4 | S20, S19, S17, S9 |
We could further analyse the information from Tables 7 and 8 and check for the overlapping or rankings of a stakeholder in multiple polarisation groups. For example, from Table 7, stakeholder S16 had a rank of 12 in both polarisation groups 1 and 2. Similarly, S11 had a rank of 21 in polarisation groups 1, 2, 4 and S21 had a rank of 24 in groups 2 and 3.
The information provided by this method offers a great insight in to the social dynamics of the decision-making group. The four stakeholders in the polarisation group 4 from experiment I do not support any position provided to them. The decision-maker might use this information and request those stakeholders to come up with a new position that they think might be more suitable to the given decision-making issue. The 6 stakeholders in group 2 and 10 stakeholders in group 3 share similar opinion with respect to the comprehensive metrics programme. Since majority of the stakeholders support this alternative, the decision-maker might choose to take the decision based on this. From Figure 11, the decision-maker can understand and identify stakeholders who had both high and low degrees of memberships. The decision-maker might also possibly look in and understand to which stakeholder can be pursued more comfortably in case they had to pursue stakeholders during the decision-making process. The information produced by the approach which is presented in Tables 4–8, Figures 10(a), 10(b) and 11 can help decision-makers and stakeholders to take more informed decisions.
6.4. Analysis of experiment II and experiment III
This sub-section presents the analysis of experiment II and experiment III. The decision issues in experiment II and experiment III were about the selection of suitable software metrics programme in a medium-scale organisation and small-scale organisation, respectively. Stakeholders exchanged 314 arguments and 176 arguments and constructed argument trees in experiment II and experiment III, respectively, using our OLIAS. The same set of stakeholders in experiment I participated in experiments II and III. The framework was applied on both the argumentation trees with c value as 4, and the system produced 4 polarisation groups in both the experiments.
From experiment II results, we learnt that the opinion vectors of the four polarisations groups were unique and no group shared the same opinion with the same strength. Polarisation group 2 had the highest number of stakeholders. Group 3 consisted of only two stakeholders. With this information, decision-makers have an opportunity for closely investigating the opinions of polarisation group 2, since it has large number of stakeholders and group 3, since it is equally important to understand the opinion of polarisation groups with few stakeholders. From experiment III results, we understood that a stakeholder in one top-k list of a polarisation group was not present in another list. In an earlier experiment, a stakeholder was spotted in two different top-k lists. These top-k lists can be used to identify leaders in polarisation groups.
The degree of membership of stakeholders in polarisation groups was different from experiment to experiment. In addition, as stakeholders interact in the dialogue process, stakeholders might change their opinions. Hence, their degree of membership in polarisation groups changed dynamically. In experiment I, a higher number of stakeholders had membership to a polarisation group with a value greater than 0.9 when compared with other experiments. The number of stakeholders with membership values greater than 0.9 to a polarisation group decreased from experiment II to experiment III. Polarisation groups across experiments were very dynamic. Stakeholders with a high degree of membership in a group usually tend to have a low degree of membership in other groups. This is logically sound. The aggregate of membership values of a stakeholder in all the polarisation groups is always equal to 1.
7. Decision support
Clearly from the experiments, we have realised that the method that we proposed in this article has provided more information than the framework (Arvapally et al. 2012) that was proposed earlier. The framework in this article has provided the membership of each stakeholder in every polarisation group. Also, the system provides a stakeholders’ highest membership value among all the membership values (in group), this explains the degree of overlap of a stakeholder's participation in other groups as well. The membership value of a stakeholder in the method proposed earlier (Arvapally et al. 2012) is either 0 or 1; however, in this article, the membership ranges from 0 to 1. In many situations, a polarisation group may have a majority number of stakeholders and still the favourability of the overall decision-making group might be different or contrasting with that polarisation group. Not only group size, but also the contribution of the group in terms of the number of arguments and the strength of the arguments affects the overall group opinion. The objective behind conducting three different experiments is to evaluate the effectiveness of the proposed framework.
A group can reject or oppose alternative solutions posted in an argumentation tree with their arguments. Very often, people form groups and veto collectively. The decisions can be overturned by opposing all the alternatives. In experiment I of the evaluation section, polarisation group 4 opposed all three alternative solutions for their decision issue.
8. Conclusion
Stakeholders in a decision-making group tend to polarise on their opinions and form polarisation groups in the argumentation process. Usually, polarisation groups may overlap and stakeholders may be members of multiple polarisation groups. Quantifying stakeholders’ degrees of membership in multiple polarisation groups in argumentation for collaborative decision-making is an important challenge which was not addressed earlier. In this article, we have presented a unique approach in identifying polarisation groups and quantifying memberships of stakeholders in polarisation groups using the fuzzy c-means clustering algorithm. We have successfully carried out the experiment, and the experiment results show that the method is successful in identifying polarisation groups in the OLIAS, and quantifying the degrees of membership of a stakeholder in multiple polarisation groups. It would help stakeholders in making more informed argumentation-based collaborative decisions since it provides insights on social dynamics among stakeholders in argumentation. Identification of outlier opinions in the argumentation system using outlier detection algorithms will be our future work.
Acknowledgements
We sincerely appreciate the Intelligent Systems Center and National University Transportation Center at the Missouri University of Science and Technology, Rolla for supporting our project. We thank the students of Software Engineering class for participating in our experiments. We sincerely thank Ms. Elizabeth Roberson, English editor for helping us to edit this article.
References
1 | Arvapally, R.S., Liu, X.F., and Jiang, W. ((2012) ), ‘Identification of Faction Groups and Leaders in Web-Based Intelligent Argumentation System for Collaborative Decision Support’, Proceedings of International Conference on Collaborative Technologies and Systems. Denver, Colorado, USA, pp. 509–516. |
2 | Atkinson, K., Bench-Capon, T., and McBurney, P. ((2006) ), ‘PARMENIDES: Facilitating Deliberation in Democracies’, Artificial Intelligence and Law, 14: (4), 261–275. doi: 10.1007/s10506-006-9001-5 |
3 | Bezdek, J.C. ((1981) ), Pattern Recognition with Fuzzy Objective Function Algorithms, Norwell, MA: Kluwer Academic Publishers. |
4 | Blei, D.M., Ng, A.Y., and Jordan, M.I. ((2003) ), ‘Latent Dirichlet Allocation’, Journal of Machine Learning Research, 3: , 993–1022. |
5 | Centola, D., and Macy, M.W. ((2007) ), ‘Complex Contagions and the Weakness of Long Ties’, American Journal of Sociology, 113: , 702–734. doi: 10.1086/521848 |
6 | Conklin, J., and Begeman, B.L. ((1988) ), ‘gIBIS: A Hypertext Tool for Exploratory Policy Discussion’, Proceedings of the ACM Conference on Computer Supported Cooperative Work, Portland, Oregon, USA, 140–152. |
7 | Deerwester, S., Dumais, S.T., Furnas, G.W., Landauer, T.K., and Harshman, R. ((1990) ), ‘Indexing by Latent Semantic Analysis’, Journal of the American Society for Information Science, 41: (6), 391–407. doi: 10.1002/(SICI)1097-4571(199009)41:6<391::AID-ASI1>3.0.CO;2-9 |
8 | Du, N., Wu, B., Pei, X., Wang, B., and Xu, L. ((2007) ), ‘Community Detection in Large-Scale Social Networks’, Proceedings of WebKDD and SNA-KDD, New York, USA. |
9 | Dung, P.M. ((1995) ), ‘On the Acceptability of Arguments and its Fundamental Role in Nonmonotonic Reasoning, Logic Programming and n-Person Games’, Artificial Intelligence, 77: , 321–357. doi: 10.1016/0004-3702(94)00041-X |
10 | Flache, A., and Macy, M.W. ((2011) ), ‘Small Worlds and Cultural Polarization’, Journal of Mathematical Sociology, 34: , 146–176. doi: 10.1080/0022250X.2010.532261 |
11 | Forgy, E. ((1965) ), ‘Cluster Analysis of Multivariate Data: Efficiency vs. Interpretability of Classifications’, Biometrics, 21: , 768–780. |
12 | Gordon, T.F., and Karacapilidis, N. ((1997) ), ‘The Zeno Argumentation Framework’, Proceedings of the Sixth International Conference on AI and Law, Melbourne, Australia, 10–18. |
13 | Granovetter, M.S. ((1973) ), ‘The Strength of Weak Ties’, American Journal of Sociology, 78: (6), 1360–1380. doi: 10.1086/225469 |
14 | Harton, H.C., Green, L.R., Jackson, C., and Latane, B. ((2000) ), ‘Demonstrating Dynamic Social Impact: Consolidation, Clustering, Correlation, and (sometimes) the Correct Answer’, Handbook of Demonstrations and Activities in the Teaching of Psychology: Personality, Abnormal, Clinical, Counseling, and Social 3: , second edition, M.E. Ware and D. Johnson, Mahwah, NJ, USA: Lawrence Erlbaum Associates, Inc., Publishers, 255–259. |
15 | Hofmann, T. ((2001) ), ‘Unsupervised Learning by Probabilistic Latent Semantic Analysis’, Machine Learning, 42: (1–2), 177–196. doi: 10.1023/A:1007617005950 |
16 | Karacapilidis, N. ((2006) ), ‘CoPe_it!: Towards Augmenting Collaboration and Learning in Communities of Practice’, Workshop in Modelling Meetings, Argumentation and Discourse, in Proceedings of the First International Conference on Computational Models of Argument, Liverpool. http://www.memetic-vre.net/MMAD/MMAD2006.Karacapilidis.pdf (accessed April 22, 2013). |
17 | Karacapilidis, N., and Papadias, D. ((2001) ), ‘Computer Supported Argumentation and Collaborative Decision Making: The HERMES System’, Information Systems, 26: , 259–277. doi: 10.1016/S0306-4379(01)00020-5 |
18 | Karacapilidis, N., Tzagarakis, M., Karousos, N., Gkotsis, G., Kallistros, V., Christodoulou, S., and Mettouris, C., ((2009) ), ‘Tackling Cognitively-Complex Collaboration with CoPe_it!’, International Journal of Web-based Learning and Teaching Technologies, 4: (3), 22–38. doi: 10.4018/jwbltt.2009090802 |
19 | Klein, M. ((2010) ), ‘Using Metrics to Enable Large-Scale Deliberation’, Collective Intelligence in Organizations: A Workshop of the ACM Group, Sanibel Island, Florida. http://www.parc.com/content/events/attachments/Klein_Group10.pdf (accessed April 22, 2013). |
20 | Klein, M. ((2012) a), ‘How to Harvest Collective Wisdom on Complex Problems: An Introduction to the MIT Deliberatorium’, MIT Center for Collective Intelligence. http://cci.mit.edu/klein/papers/deliberatorium-intro.pdf accessed (December 30, 2012). |
21 | Klein, M. ((2012) b), ‘Enabling Large-Scale Deliberation Using Attention-Mediation Metrics’, Journal of Computer Supported Cooperative Work (CSCW), 21: , 449–473. doi: 10.1007/s10606-012-9156-4 |
22 | Kraus, S., Sycara, K., and Evenchik, A. ((1998) ), ‘Reaching Agreements Through Argumentation: A Logical Model and Implementation’, Journal of Artificial Intelligence, 104: (1–2), 1–69. doi: 10.1016/S0004-3702(98)00078-2 |
23 | Kunz, W., and Rittel, H. ((1970) ), ‘IBIS: Issues as Elements of Information Systems’, Working paper 131. Institute of Urban and Regional Development, University of California, Berkeley, California. |
24 | Latane, B. ((1981) ), ‘The Psychology of Social Impact’, American Psychologist, 36: , 343–356. doi: 10.1037/0003-066X.36.4.343 |
25 | Latane, B. ((1996) ), ‘Dynamic Social Impact: The Creation of Culture by Communication’, The Journal of Communication, 46: , 13–25. doi: 10.1111/j.1460-2466.1996.tb01501.x |
26 | Latane, B., and Wolf, S. ((1981) ), ‘The Social Impact of Majorities and Minorities’, Psychological Review, 88: , 438–453. doi: 10.1037/0033-295X.88.5.438 |
27 | Liu, X.F., Barnes, E.C., and Savolainen, J.E. ((2012) ), ‘Conflict Detection and Resolution for Product Line Design in a Collaborative Decision Making Environment’, Proceedings of Computer Supported Cooperative Work, Seattle, Washington. |
28 | Liu, X.F., Khudkhudia, E., and Leu, M. ((2008) ), ‘Incorporation of Evidences into an Intelligent Computational Argumentation Network for a Web-Based Collaborative Engineering Design System’, Proceedings of International Symposium on Collaborative Technologies and Systems, Irvine, California, 376–382. |
29 | Liu, X.F., Khudkhudia, E., Wen, L., Sajja, V., and Leu, M. ((2009) ), ‘An Intelligent Computational Argumentation System for Supporting Collaborative Software Development Decision Making’, Artificial Intelligence Applications for Improved Software Engineering Development, F. Meziane and S. Vadera, Hershey: IGI Global, 167–180. |
30 | Liu, X.F., Raorane, S., and Leu, M. ((2007) ), ‘A Web-based Intelligent Collaborative System for Engineering Design’, Collaborative Product Design and Manufacturing Methodologies and Applications, W.D. Li, S.K. Ong, Y.C. Andrew, and C. McMohan, Springer Series in Advanced Manufacturing, London, United Kindgom: Springer-Verlag, pp. 37–58. |
31 | Liu, X.F., Wanchoo, R., and Arvapally, R.S. ((2011) ), ‘Empirical Study of an Intelligent Argumentation System in MCDM’, The International Conference on Collaboration Technologies and Systems, Philadelphia, Pennsylvania, 125–133. |
32 | Macqueen, J.B. ((1967) ), ‘Some Methods for Classification and Analysis of Multivariate Observations’, Proceedings of 5th Berkeley Symposium on Mathematical Statistics and Probability, University of California, Berkeley, California, USA: University of California Press, pp. 281–297. |
33 | Macy, M.W., Kitts, J., Flache, A., and Benard, S. ((2003) ), ‘Polarization in Dynamic Networks: A Hopfield Model of Emergent Structure’, Dynamic Social Network Modeling and Analysis: Workshop Summary and Papers the national academies press, 162–173. |
34 | Newman, M.E.J. ((2004) ), ‘Detecting Community Structure in Networks’, The European Physical Journal – Condensed Matter and Complex Systems, 38: , 321–330. doi: 10.1140/epjb/e2004-00124-y |
35 | Newman, M.E.J., and Girvan, M. ((2004) ), ‘Finding and Evaluating Community Structure in Networks’, Physical Review E, 69: , 026113, pp. 1–15. |
36 | Satyavolu, M. ((2010) ), ‘Contribution-Based Priority Assessment in a Web-Based Intelligent Argumentation Network for Collaborative Software Development,’ Thesis, Missouri University of Science and Technology, Rolla. http://scholarsmine.mst.edu/thesis/pdf/Satyavolu_09007dcc8082f337.pdf (accessed January 7, 2013). |
37 | Sillince, J.A.A. ((1995) ), ‘A Model of Social, Emotional and Symbolic Aspects of Computer-Mediated Communication within Organizations’, Journal of Computer Supported Cooperative Work (CSCW), 4: (1), 1–31. doi: 10.1007/BF00823361 |
38 | Sillince, J.A.A., and Saeedi, M.H. ((1999) ), ‘Computer-Mediated Communication: Problems and Potentials of Argumentation Support Systems’, Journal of Decision Support Systems (DSS), Elsevier, 26: , 287–306. doi: 10.1016/S0167-9236(99)00058-5 |
39 | Simpson, B., and Macy, M.W. ((2004) ), ‘Power, Identity, and Collective Action in Social Exchange’, Social Forces 82: (4), 1371–1409. |
40 | Sunstein, C.R. ((1999) ), ‘The Law of Group Polarization’, Journal of Political Philosophy, 10: , 175–195. doi: 10.1111/1467-9760.00148 |
41 | Takacs, K. ((2005) ), ‘An Experimental Analysis of Network Segregation and Intergroup Conflict’, Review of Sociology, 11: (1), 5–34. doi: 10.1556/RevSoc.11.2005.1.1 |
42 | Toulmin, S. ((1958) ), The Uses of Argument, Cambridge: Cambridge University Press. |
43 | Tzagarakis, M., Gkotsis, G., Hatzitaskos, M., Karousos, N., and Karacapilidis, N. ((2009) ), ‘CoPe_it!: Argumentative Collaboration towards Learning’, Computer Supported Collaborative Learning Practices: CSCL 2009 Community Events Proceedings, A. Dimitracopoulou, C. O'Malley, D. Suthers, and P. Reimann, Greece: Rhodes, 126–128. |
44 | Tzagarakis, M., Karousos, N., Gkotsis, G., Kallistros, V., Mettouris, C., Kyriakou, P., and Nousia, D. ((2010) ), ‘From Collecting to Deciding: Facilitating the Emergence of Decisions in Argumentative Collaboration’, Web-Based Learning Solutions for Communities of Practice: Developing Virtual Environments for Social and Pedagogical Advancement, IGI Global, Hershey, Pennsylvania, 128–142. |
45 | Vennam, J.R., and Vadapalli, S. ((2005) ), ‘Syndeca: A Tool to Generate Synthetic Datasets for Evaluation of Clustering Algorithms’, Proceedings of International Conference on Management of Data (COMAD 2005), Goa, India, 27–36. |
46 | Vesic, S., Ianchuk, M., and Rubtsov, A. ((2012) ), ‘The Synergy: A Platform for Argumentation-Based Group Decision Making’, Computational Models of Argument, B. Berheij, Vienna, Austria: IOS Press, 501–502. |
47 | Vimal, A., Valluri, S.R., and Karlapalem, K. ((2008) a), ‘An Experiment with Distance Measures for Clustering’, Proceedings of International Conference on Management of Data (COMAD 2008), December 17–19. Mumbai, India, 241–244. |
48 | Vimal, A., Valluri, S.R., and Karlapalem, K. ((2008) b), ‘An Experiment with Distance Measures for Clustering’, Technical Report IIIT/TR/2008/132, Center for Data Engineering, International Institute of Information Technology, Hyderabad. |
49 | Walton, D.N., and Krabbe, E.C.W. ((1995) ), ‘Commitment in Dialogue’, SUNY Press, 65–66. |
50 | Wirth, R. (2000) , ‘CRISP-DM: Towards a Standard Process Model for Data Mining’, Proceedings of the Fourth International conference on the Practical Application of Knowledge Discovery and Data Mining, New York, NY, USA, 29–39. |
51 | Zhang, S., Wang, R.S., and Zhang, X.S. ((2007) ), ‘Identification of Overlapping Community Structure in Complex Networks Using Fuzzy c-Means Clustering’, Physica A: Statistical Mechanics and its Applications, 374: , 483–490. doi: 10.1016/j.physa.2006.07.023 |

