
Cognitive shortcuts in causal inference
Abstract
The paper explores the idea that causality-based probability judgments are determined by two competing drives: one towards veridicality and one towards effort reduction. Participants were taught the causal structure of novel categories and asked to make predictive and diagnostic probability judgments about the features of category exemplars. We found that participants violated the predictions of a normative causal Bayesian network model because they ignored relevant variables (Experiments 1–3) and because they failed to integrate over hidden variables (Experiment 2). When the task was made easier by stating whether alternative causes were present or absent as opposed to uncertain, judgments approximated the normative predictions (Experiment 3). We conclude that augmenting the popular causal Bayes net computational framework with cognitive shortcuts that reduce processing demands can provide a more complete account of causal inference.
The psychology of causal inference is experiencing growing pains. A proliferation of interest in causal reasoning over the last several years is due in large part to the development of causal Bayesian networks, a computational framework for learning, representing and reasoning with causal knowledge. Causal Bayes nets are normative models that are governed by the axioms of probability, and psychological theories based on causal Bayes nets therefore predict that causal judgment should accord with norms. In line with this idea is a variety of evidence that people (including young children) are sophisticated and adept causal reasoners. However, as we detail below, probability judgments based on causal evidence do not always honor the norms associated with Bayes nets, suggesting that understanding such judgments will require considering nonnormative factors imposed by the cognitive processes that implement causal reasoning.
We will argue that causal judgments can be viewed as emerging from an interaction between two competing drives: one towards veridicality and one towards effort reduction. We will illustrate this claim for a paradigmatic task, namely, judging the conditional probability of a hypothesis given causally relevant evidence. We present an analysis of the requirements for optimal performance on this task, one that suggests a number of task variables that may invite reasoners to reduce effort by taking shortcuts that result in inappropriate conclusions. In three experiments we manipulate these variables with an eye to identifying which normative requirements people typically violate and to establishing conditions that support more veridical judgment.
Causal Bayes nets and the normativity of causal inference
People are good at qualitative, contextualised reasoning about the causal systems they interact with in their lives (Sloman 2005). People often have good intuitions for instance about what actions to take to achieve a goal, what caused them to feel ill, or how a new coach will influence the performance of their favorite team. This capability has prompted substantial interest in a theory of mental representation that accounts for causal intuitions: a causal model theory (Waldmann and Holyoak 1992; Glymour 1998; Gopnik, Glymour, Sobel, Schulz and Kushnir 2004). Causal model theories are usually instantiated using causal Bayesian networks, graphs where events or properties and their causal relations are depicted as variable nodes and directed edges (arrows) that point from cause to effect (Spirtes, Glymour and Scheines 1993; Pearl 1988, 2000; Jordan 1999). A causal Bayes net is associated with functions that specify how the probabilities of effects change in the presence of their causes. These functions allow for the calculation of the probability of unknown variables conditioned on known ones and thus support inductive inference.
Since causal Bayes nets are based on probabilistic calculus, psychological theories based on these models predict that human causal inference should respect probabilistic norms when people can apply an appropriate causal model. A variety of evidence supports this idea: People honour many causal reasoning norms not only during simple inferences (Rehder and Burnett 2005) but also more complex causal inferences involving analogies (Lee and Holyoak 2008; Holyoak, Lee and Lu 2010), generalisations (Rehder and Hastie 2004; Rehder 2006, 2009; Shafto, Kemp, Bonawitz, Coley and Tenebaum 2008; Kemp and Tenenbaum 2009), and acts of classification (Rehder and Hastie 2001; Rehder 2003a, b; Rehder and Kim 2006, 2009, 2010). Research on development shows that even children's reasoning is more consistent with causal than associative models by age 4 (Sobel, Tenenbaum and Gopnik 2004; Hayes and Thompson 2007; Opfer and Bulloch 2007; Hayes and Rehder in press). Finally, Causal Bayes nets are also attractive to learning theorists because causal structures and parameters can (in principle) be learned from data (Waldmann et al., 1995; Cheng 1997; Novick and Cheng 2004; Griffiths and Tenenbaum 2005, 2009; Lu, Yuille, Liljeholm, Cheng and Holyoak 2008;, but see Fernbach and Sloman 2009). Causal models provide a better account than associative models for such learning in both adults (Waldmann and Holyoak 1992; Waldmann 2000; for a review see Holyoak and Cheng 2011) and children (Gopnik et al. 2004; Sobel et al. 2004), and sometimes nonhumans (Beckers, De Houwer, Miller and Urushihara 2006; Blaisdell, Sawa, Leising and Waldmann 2006). In summary, causal Bayes nets have provided a valuable organising framework for a large variety of reasoning and learning phenomena.
Despite these successes, other phenomena suggest that causal inference is error-prone. Many counternormative phenomena from the heuristics and biases literature – such as conjunction fallacies (Tversky and Kahneman 1983), subadditive probability judgments (Tversky and Koehler 1994; Rottenstreich and Tversky 1997), simulation effects (Kahneman and Tversky 1982; Wells and Gavanski 1989), and hindsight biases (Fischhoff and Beyth 1975) emerge (and are sometimes exacerbated) in causal scenarios. Tversky and Kahneman (1980) argue that causal reasoning is qualitatively different from a more appropriate evaluation of evidential strength and therefore leads to biased judgment. Moreover, people sometimes confuse the causal role of their actions. This leads to ‘diagnostic self-deception’ (Quattrone and Tversky 1984; Sloman, Fernbach and Hagmayer 2010) and other examples of ‘evidential reasoning’ such as cooperation in the prisoner's dilemma and the voter's illusion (Acevedo and Krueger 2005). People also sometimes feel a false sense of control over outcomes that are actually up to chance or risk (Langer 1975) leading to idiosyncratic superstitions like reluctance to “tempt fate” (Risen and Gilovich 2008; Swirsky, Fernbach and Sloman 2011). In the causal learning literature as well, researchers have documented conditions in which learners depart from the normative acquisition rules specified by Bayes nets (De Houwer and Beckers, 2003; Reips and Waldmann 2008; Waldmann and Walker 2005).
Yet a different kind of error was uncovered in a series of studies by Fernbach, Darlow and Sloman (2010, 2011a). Following Tversky and Kahneman (1980) they compared predictive reasoning – judgment of the conditional probability of an effect given a cause – to diagnostic reasoning – judgment of the conditional probability of a cause given an effect. By varying causal structure and collecting judgments of conditional probability about a variety of scenarios, they were able to evaluate the consistency of judgments in both directions of reasoning. In predicting an effect from a cause, participants systematically neglected the contribution of alternative causes to the probability of the effect. They based their judgments just on the strength of the cause known to be present, and therefore gave conditional probability judgments that were too low. In contrast, diagnostic judgments were sensitive to the strength of alternative causes and approximately consistent with the predictions of a causal Bayes net model.
Fernbach, Darlow and Sloman (2011b) established the robustness of the neglect of alternative causes in a series of experiments assessing conditional probability judgments and gambling decisions in the face of a weak but positive predictive evidence. Ignoring alternative causes can be a serious error when the conditional probability is high, but the contribution of the given cause to that probability is small. Indeed, Fernbach et al. found cases where the conditional probability of the effect given a weak cause is judged lower than the marginal probability of an effect (i.e. the probability of the effect when no evidence is mentioned). For instance, participants told about weak but positive evidence that the Republicans would win the House of Representatives in the 2010 US mid-term election (a newspaper endorsement of a single candidate) were actually less likely to gamble on the Republicans winning than participants given no evidence. Apparently, the focus on the single cause mentioned in a conditional judgment crowded out other causes that would otherwise be considered. Fernbach et al. refer to this as the weak evidence effect.
Effort reduction as a reconciliatory principle
Why might people violate the norms of causal Bayes nets and probability theory more generally? A few authors have tried to bring theoretical organisation to the heuristics and biases literature by appealing to effort reduction as a fundamental drive of human cognition. Kahneman and Frederick (2002) argue that a heuristic is a surreptitious substitution of an easy question for a hard one. More recently, Shah and Oppenheimer (2008) taxonomised a large number of heuristics according to their role in reducing effort relative to what would be required by a full optimal solution to the weighted-additive choice rule (Payne, Bettman and Johnson 1993). They argue that the optimal solution is out of reach because it requires a complex series of processes with many inputs and computational demands. One might argue that the appeal to effort reduction is too vague to provide much explanatory power on its own. We agree with this point, and our goal in this paper is not to litigate this issue but merely to demonstrate the types of shortcuts people make in causal reasoning.
Like the weighted-additive rule, normative causal inference imposes substantial computational demands. Consider the many steps required to render a causal-based judgment of conditional probability: first, a qualitative representation or model of the causal situation must be constructed. This involves not only identifying the causal relations that directly relate evidence and hypotheses but also filling in additional causal variables that may be relevant to the judgment, including alternative causes, enabling conditions, disabling conditions, and so forth. At this step, two sorts of errors may arise. Errors of omission may occur when relevant variables are not included in the model. This may occur because a reasoner's cursory search of long-term memory may fail to yield all relevant knowledge. In contrast, errors of commission occur when relevant knowledge that is readily available (e.g. already retrieved from memory, supplied as part of the reasoning problem, etc.) is nevertheless ignored by the reasoner.
Next, one must identify the functional relations by which causes bring about effects and parameterise those relations (e.g. with the strength of the causal relations). Judgment errors may arise at this stage if causal relations are represented in a simplified form (e.g. as a symmetric associative relation, Rehder 2009) or if causal strengths are represented with low fidelity (e.g. qualitatively rather than quantitatively).
Third, to assess the net influence of hidden variables, the reasoner must integrate over their possible states. To illustrate the importance of integrating over the states of potential alternative causes, it is useful to consider the normative equations for causal inferences based on a reasonably general noisy or parameterisation associated with generative causes between binary variables (for details see Waldmann, Cheng, Hagmayer and Blaisdell 2008; Rehder 2010; Fernbach et al. 2011a). Equation (1) specifies the probability of the effect given the cause assuming that it can be brought about by the focal cause itself (with probability WC) or by one or more alternative causes (with probability
Equation (3) suggests a number of shortcuts that reasoners may take in accounting for the influence of alternative causes. For example, for each alternative cause Ai reasoners may assume values for
Fourth, once a causal model is constructed, parameterised, and the effect of hidden causal factors computed, reasoners must aggregate the influence of the focal and alternative causes to render a judgment of conditional probability. Errors may be introduced at this stage if they choose to use a qualitative combination rule instead of Equation (1) or (2).
Overview of experiments
The analysis just presented suggests a number of hypotheses regarding why errors arise during causal inferences: (a) relevant variables may not be retrieved from memory, (b) their representation may be deleted from the causal model, (c) integration may rely on shortcuts that misrepresent their influence, and (d) alternatives may not be aggregated appropriately with the focal cause. The aim of the following experiments was to conduct a first assessment of the extent to which each of these shortcuts influence causal reasoning. We taught people novel categories by describing a category's features, its causal model (the structure of its interfeature causal relations), and the model's parameters (the strengths of those relations). After being trained on a novel category, subjects were presented with a category member that possessed one or more features and asked for the likelihood that another feature was present. Following Fernbach et al. (2011a), we varied both the direction of inference (i.e. predicting effects from causes and diagnosing causes from effects) and the strengths of the focal and alternative causes. Specifying causal strengths also allowed us to calculate the normative responses to the inference questions and thus identify conditions that lead to errors. In Experiment 1, we extended Fernbach et al.’s (2011a) design to a task with novel categories where memory retrieval requirements were minimised (participants were provided with a diagram of the category's causal model during the inference task). In Experiment 2, we varied the number and explicitness of alternative causes and the computational difficulty of aggregating parameters. In Experiment 3, we varied whether alternative causes are unknown, known to be present or known to be absent in a particular category member.
Experiment 1
Participants in Experiment 1 were taught one of the two category structures in Figure 1. All subjects learned categories with four binary features. Feature Cw was described as the cause of Ew and Cs was described as the cause of Es. Examples of features and causal relationships are shown in Table 1. Our central manipulation concerned the different strengths of the alternative causes of the two effect features. To convey the presence of alternative causes, both Ew and Es were described as also being caused by “one or more” unnamed category features. However, the alternative causes of Ew were described as relatively weak (hence the “w” subscript) by stating that Ew appeared in category members with probability 25% even when Cw was absent. In contrast, the alternative causes of Es were described as relatively strong (“s”) by stating that it appeared in category members with probability 75% even when Cs was absent.
Figure 1.
Causal structure tested in Experiment 1: (A) strong focal cause condition and (B) weak focal cause condition.
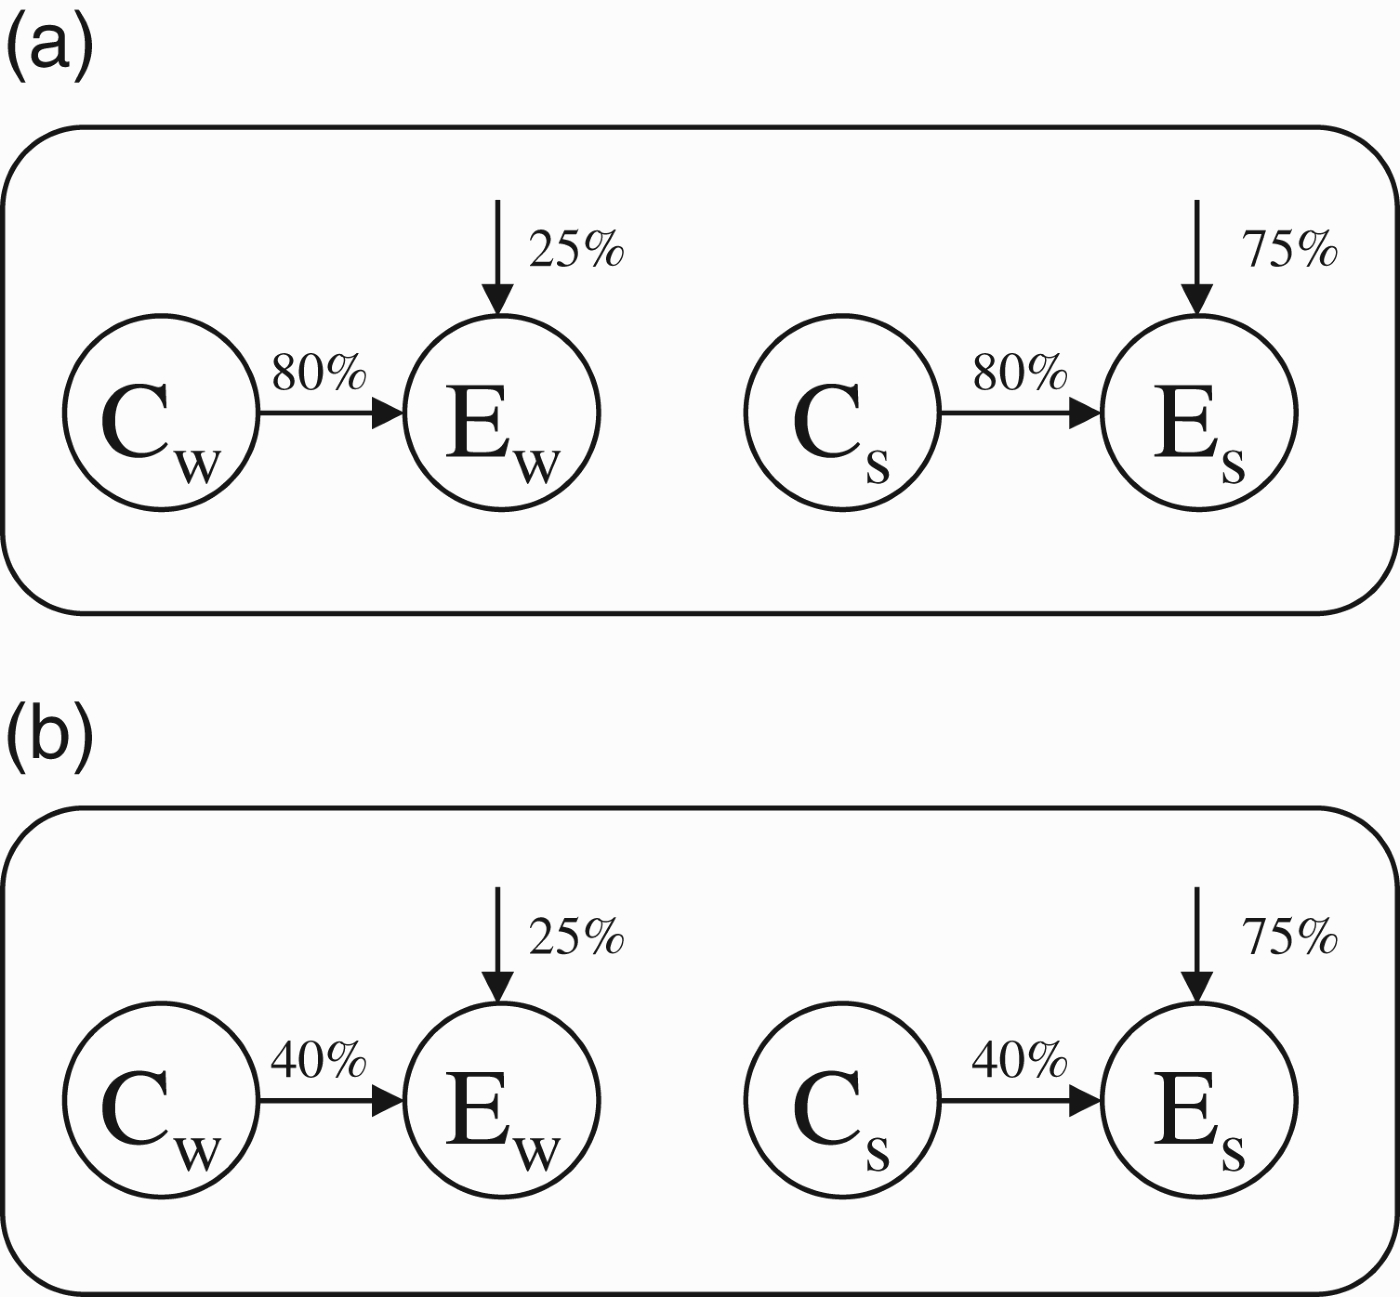
Table 1.
Features and causal relationships for Myastars, an artificial category.
| Feature | Causal relationship |
| Ionised helium | Ionised helium causes the star to be very hot. Ionised helium participates in nuclear reactions that release more energy than the nuclear reactions of normal hydrogen-based stars, and the star is hotter as a result |
| Very hot temperature | |
| High density | High density causes the star to have a large number of planets. Helium, which cannot be compressed into a small area, is spun off the star, and serves as the raw material for many planets |
| Large number of planets | |
After learning, participants were asked a series of conditional probability questions. On predictive questions they were told that a particular category member possessed a cause feature and were asked to judge the likelihood that it possessed the relevant effect feature, and vice versa for diagnostic questions. Subjects were also asked to predict the cause and effect given the absence of the effect and cause, respectively. Finally, subjects were asked to make unconditional (i.e. marginal) judgments by estimating the prevalence of each feature in a category. Effects should be judged to be more prevalent to the extent they have strong vs. weak alternative causes.
Unlike in Fernbach et al.’s (2011a) studies, participants did not have to retrieve causal knowledge from memory. Participants learned the novel interfeature causal relations as part of the experiment and were provided with a diagram of the causal relations during the inference test. Participants were also provided with explicit information regarding both the functional form of the relationship (in the form of a description of the causal mechanism by which the cause generates the effect) between the cause and effect features and the strength of those relationships (by specifying how often a cause, when present, would generate its effect). Finally, the effect of alternative causes was provided in summary form, eliminating the need to integrate over hidden causes. That is, by telling them it was either weak (25%) or strong (75%), reasoners were directly provided with the value of WNetAlt (the net effect of all alternative causes), relieving them of the need to compute it via Equation (3).
A secondary objective of Experiment 1 was to assess whether the neglect of alternative causes depends on the strength of the focal cause itself. To this end, the strengths of the focal causes (between Cw and Ew, and Cs and Es) were manipulated as a between-subjects variable. Half of the subjects were told that the strength of these relationships was 40% (Figure 1(A)), whereas the other half was told that their strength was 80% (Figure 1(B)). This manipulation is of theoretical interest because it speaks about the possibility that reasoners exhibit strategic laziness, they neglect alternative causes only when doing so is unlikely to yield large errors in judgments. When a focal cause is strong (e.g. 80%), the maximum error in predictive inference cannot exceed 20% (because the effect cannot be more probable than 100%), whereas it may be as large as 60% for a weak focal cause of 40%. This raises the possibility that subjects in Experiment 1 may be less likely to neglect alternative causes in the weak focal cause condition than the strong one.
We summarise by presenting the normative predictions for this experiment in Figure 2.11 First, normative predictions for predictive inferences (computed from Equation (1)) are shown in Figure 2(A). This panel confirms that such inferences ought to be sensitive to alternative cause strength and this sensitivity ought to be larger for weak (40%) vs. strong (80%) focal causes. Second, Figure 2(B) shows that diagnostic inferences (Equation (2)) should also be sensitive to alternative causes and, on the basis of previous research, we predict that they will be in this experiment. The probability of an effect given the absence of the focal cause (panel C) is simply the net strength of the alternatives (WNetAlt). Finally, Figure 2(D) reveals that predicting a cause given the absence of the effect (panel D) should be sensitive to the strength of the focal cause but not the strength of the alternative cause.22 We assess where the inferences made by human causal reasoners diverge from those in Figure 2.
Figure 2.
Normative predictions for Experiment 1. Predictions are generated assuming a base rate of 0.67 for cause features Cw and Cs. (A) Inferring an effect given the presence of its cause, (B) inferring a cause given the presence of its effect, (C) inferring an effect given the absence of its cause, and (D) inferring a cause given the absence of its effect.
Method
Materials
Six novel categories were tested: two biological kinds (Kehoe Ants and Lake Victoria Shrimp), two nonliving natural kinds (Myastars [a type of star] and Meteoric Sodium Carbonate), and two artefacts (Romanian Rogos [a type of automobile] and Neptune Personal Computers). Each category had four binary feature dimensions. One value on each dimension was described as typical of the category and the other was described as atypical. For example, participants who learned Myastars were told that “Most Myastars have very hot temperature whereas some have a low temperature”, “Most Myastars have high density whereas some have a low density”, and so on.
Subjects were also provided with causal knowledge corresponding to the structures in Figure 1. Each causal relationship was described as one typical feature causing another, with one or two sentences describing the mechanism responsible for the causal relationship (see Table 1 for an example). In addition, a sentence describing the strength of the relationship (either 40% or 80%) was worded to convey the fact that the strength represented the power or propensity of the cause to individually produce the effect (rather than a conditional probability of the effect given the cause). For example, for the Myastar causal relationship between high density and a large number of planets, subjects were told “Whenever a Myastar has high density, it will cause that star to have a large number of planets with probability x%”, where x was either 40 or 80. Note that Experiment 2 changes this wording to further emphasise the generative nature of the causal strength information.
Participants were also given information about the possibility of alternative causes of Ew and Es. For example, participants who learned about Myastars learned not only that high density causes a large number of planets but also that “There are also one or more other features of Myastars that cause a large number of planets. Because of this, even when its known cause (high density) is absent, a large number of planets occurs in x% of all Myastars”, where x was either 25 or 75. The assignment of the four typical category features to the roles Cs, Ew, Cs, and Es in Figure 1 was balanced over subjects, such that for each category a pair of features played the role of Cw and Ew for half the subjects and Cs and Es for the other half. The features and causal relationships for all six categories are available from the authors.
Participants
Ninety-six New York University undergraduates received course credit for participating in this experiment. There were three between-subject factors: weak (40%) vs. strong (80%) focal causes, the two assignments of physical features to roles of Cw,
Procedure
Experimental sessions were conducted by a computer. Participants first studied several screens of information that presented the category's cover story, which features occurred in “most” vs. “some” category members, the two causal relationships (their strength and causal mechanism), the presence of alternative causes (strengths of 25% or 75%) for features Ew and Es, and a diagram similar to that in Figure 1. When ready, participants took a multiple-choice test that tested them on the knowledge they had just studied. While taking the test, participants were free to return to the information screens; however, doing so obligated them to retake the test.
Participants then performed inference and feature likelihood tests. During the inference test, participants were presented with two blocks of eight inference questions. Four of the eight questions involved features Cw and Ew. They were asked to predict the effect, given the presence of the cause and its absence and to predict the cause given the presence of the effect and its absence, that is, to estimate
During the feature likelihood rating task that followed the inference test, each of the two features on the four binary dimensions was presented on the computer screen and what proportion of all category members possessed that feature was rated by the subjects. The order of these trials was randomised for each participant. Subjects could continue to refer to the printed diagram of causal relationships during this test.
Results
Inference ratings
An initial analysis of the inference ratings revealed no effects of which of the six categories participants learned and the assignment of category features to the roles of Cw, Ew, Cs, and Es in Figure 1. Thus, the average inference ratings collapsed over these factors and are presented in Figure 3 for each type of inference as a function of the strengths of the focal and alternative causes.
Figure 3.
Inference ratings from Experiment 1 as a function of the strengths of the focal and alternative causes. (A) Inferring an effect given the presence of its cause, (B) inferring a cause given the presence of its effect, (C) inferring an effect given the absence of its cause, and (D) inferring a cause given the absence of its effect. Error bars are standard errors of the mean. †p<0.10. *p<0.05. **p<0.01.
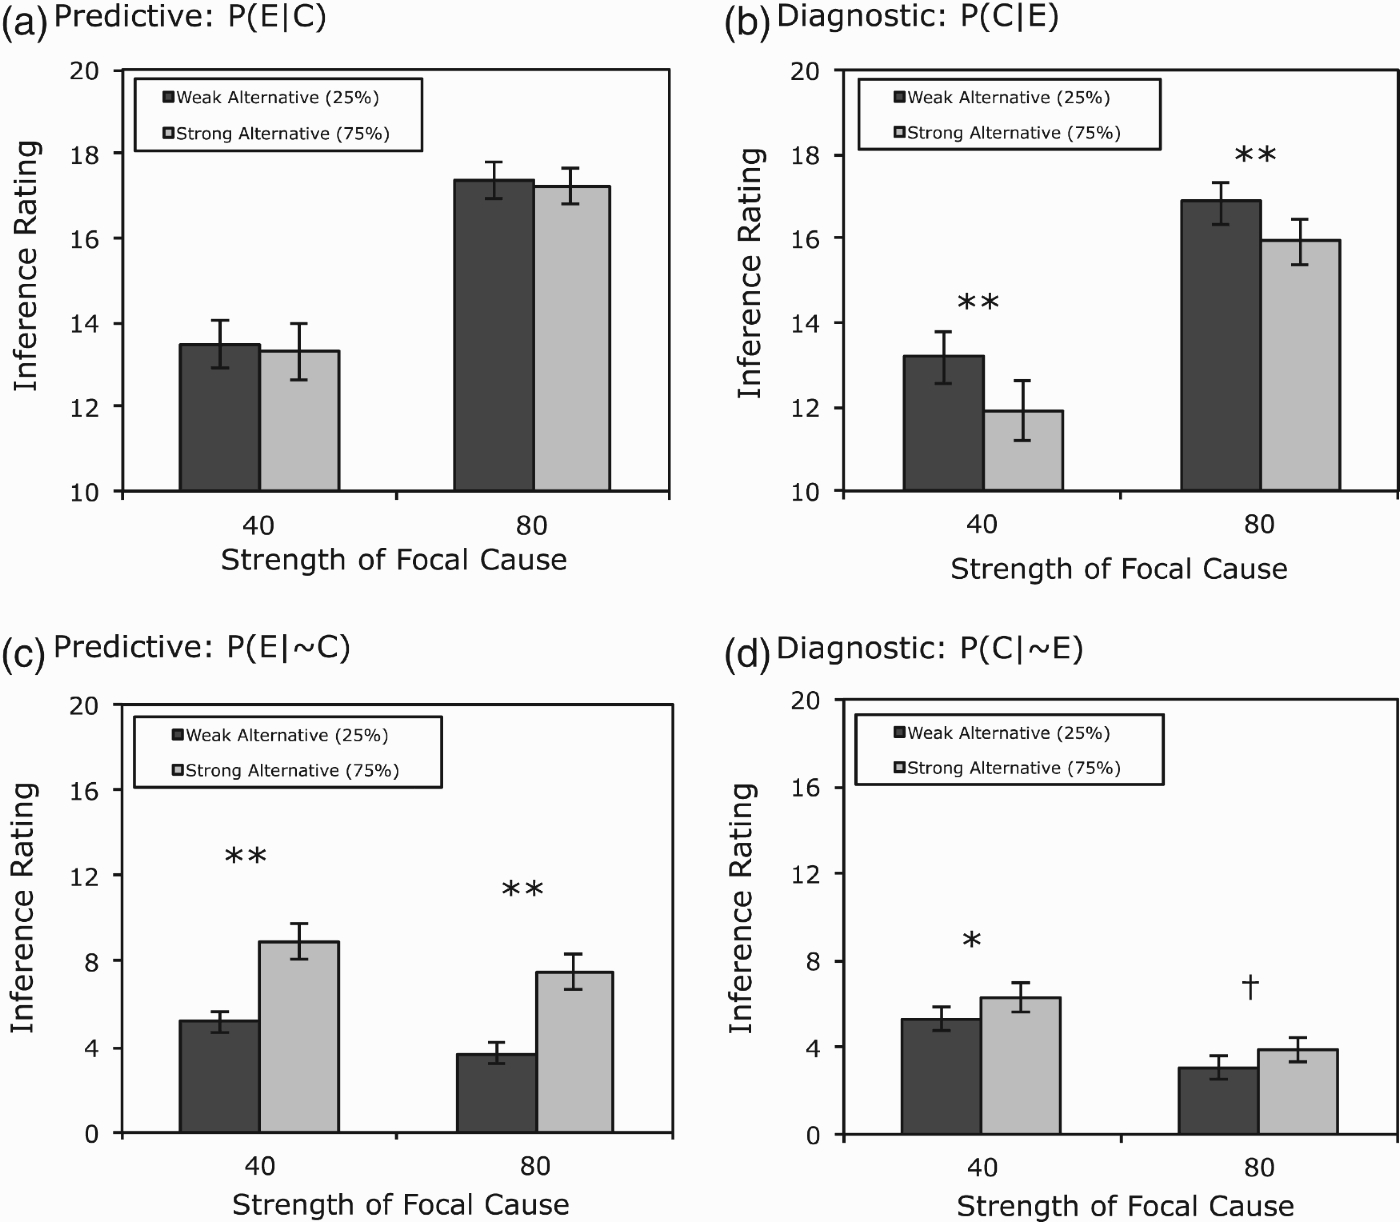
The key question of Experiment 1 concerned whether predictive inferences would be sensitive to the strength of the effect's alternative causes, and in turn whether this effect would be moderated by the strength of the focal cause. In fact, the predictive ratings shown in Figure 3(A) indicate that although subjects correctly rated the effect feature to be more likely for stronger (80%) vs. weaker (40%) focal causes (ratings of 17.3 vs. 13.4, respectively), in neither condition were the ratings at all affected by the strength of the alternative causes. A 2×2 mixed ANOVA with focal cause strength as the between-subject factor and alternative cause strength as the within-subject factor revealed a main effect of focal cause strength, F(1, 94)=31.27,
In contrast (and also consistent with the previous results), inferences in the diagnostic direction were sensitive to the strength of the alternative causes. Figure 3(B) reveals not only that ratings were higher for stronger vs. weaker focal causes (average of 16.4 vs. 12.6 in 80% and 40% conditions, respectively), they were lower for stronger vs. weaker alternative causes (13.9 vs. 15.1), consistent with the fact that a cause is less likely when stronger alternative causes are present. A 2×2 ANOVA revealed a main effect of focal cause strength, F(1, 94)=24.67,
Figure 3(C) presents the predictive ratings in which the category member was explicitly stated as having the atypical value on the cause dimension (e.g. a Myastar with low rather than high density). These inferences were correctly sensitive to the strength of the alternative cause (average ratings of 8.2 vs. 4.4 in 75% and 25% conditions, respectively). A 2×2 ANOVA revealed a main effect of alternative cause strength, F(1, 94)=40.60,
Finally, Figure 3(D) presents the diagnostic ratings in which the category member was explicitly stated as having the atypical value on the effect dimension (e.g. a Myastar with a small number of planets). As expected, these inferences were sensitive to the strength of the focal cause (ratings of 5.8 vs. 3.5 in 80% and 40% conditions, respectively). A 2×2 ANOVA confirmed a main effect of focal cause, F(1, 94)=9.75,
Feature likelihood ratings
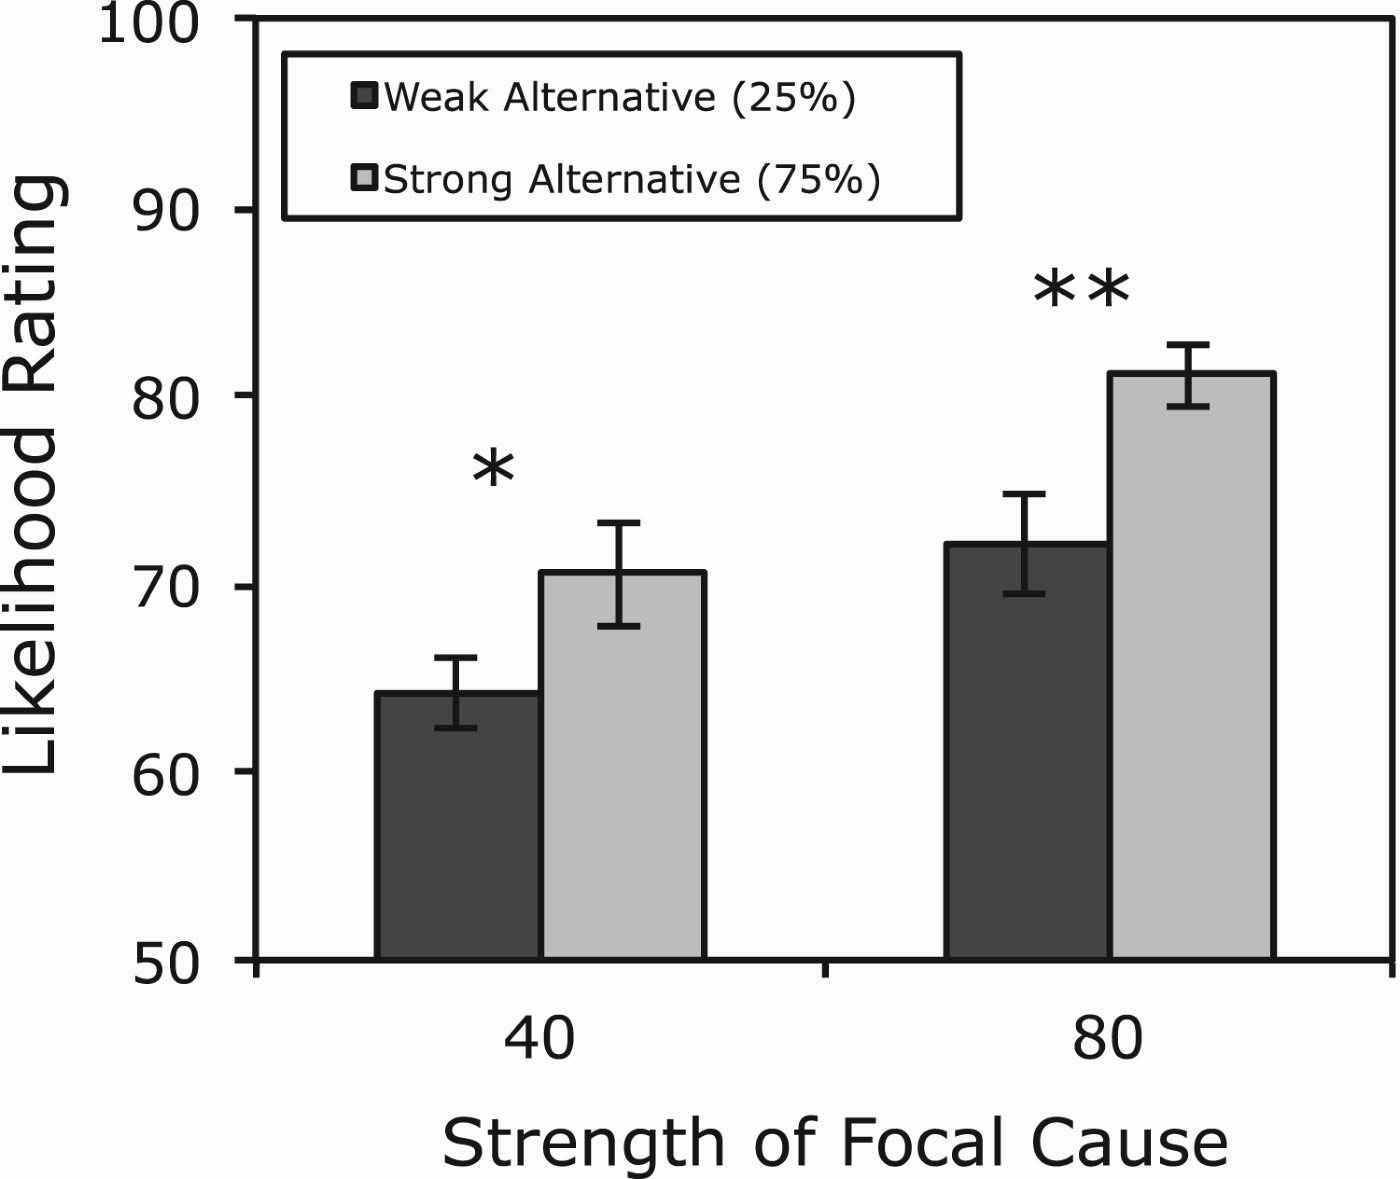
The purpose of the feature likelihood test was to confirm that judgments regarding the prevalence of the effect features Ew and Es reflected the strengths of the focal and alternative causes. The likelihood ratings for the effect features are presented in Figure 4 as a function of the two types of strengths. As expected, the effect features were rated as more prevalent both for stronger vs. weaker focal causes (76.6 vs. 67.3) and stronger vs. weaker alternative causes (75.8 vs. 68.1). A 2×2 ANOVA revealed a main effect of focal cause strength, F(1, 94)=11.62,
Figure 4.
Likelihood ratings for the effect features (Ew and Es in Figure 1) from Experiment 1. Error bars are standard errors of the mean. *p<0.05. **p<0.01.
Discussion
Despite the extensive differences in methodology, Experiment 1 replicated the results of Fernbach et al. (2010, 2011a) showing no sensitivity to alternative strength in predictive inferences. This pattern emerged despite the facts that providing participants with a diagram of the causal structure eliminated the need to retrieve causal relations from memory and that providing the strength of alternative causes in summary form eliminated the need to integrate over hidden variables. Diagnostic inferences, in contrast, were appropriately sensitive to the alternative causes, consistent with the asymmetry between predictive and diagnostic inferences also found in previous research.
An important question is whether the neglect of alternatives during predictive inferences reflected subjects’ misunderstanding of the information we provided about alternative cause strength. Two sources of evidence argue against this possibility. First, subjects rated the effect as more likely for strong vs. weak alternative causes when the focal cause was absent. Second, subjects’ unconditional judgments concerning the prevalence of the effect features among category members were also sensitive to the alternatives. That is, subjects were able to make use of the alternative cause information for several types of judgments, but not those involving predicting an effect given the presence of a cause.
Another concern is whether the information we provided about the strength of the focal causes was interpreted as a causal power, that is, the propensity of the cause to produce the effect. For example, neglect of alternatives would be expected if those strengths were instead interpreted as a conditional probability that incorporates the effect of alternative causes. Recall, however, that this strength information was provided as part of a description that emphasised the generative nature of the causal mechanisms and that the causal powers were written on the links on the diagrams given to participants (making it clear that they referred to the individual relations). More importantly, subjects’ unconditional feature likelihood judgments were sensitive to the strength of the alternative causes showing that participants realised that the proportion of category members possessing the effect feature was higher when alternatives were strong. In Experiment 2, the causal strength information was reworded to further emphasise the generative interpretation of the strength information.
A final important result from Experiment 1 was that alternative causes were neglected during predictive inferences regardless of the strength of the focal cause. This resulted in an especially egregious judgment error in the weak focal cause condition in which an effect given the cause should be 30% more likely for a strong vs. weak alternative cause (Figure 2(A)). This suggests that reasoners’ neglect of alternatives does not only arise when the error in judgment is likely to be small. Rather than arising from a reasoner's strategic decision to neglect alternatives, doing so appears to operate as a general heuristic that occurs regardless of the potential loss of accuracy involved.
Experiment 2
In Experiment 1 we found that reasoners fail to attend to alternative causes in predictive inferences even when the need to retrieve them from memory and integrate over their possible states was eliminated. One reason this may have occurred is that even though a representation of the alternative causes was literally right in front of them, reasoners may not have recognised their relevance to predictive inferences. That is, they may have committed what we referred to earlier as an error of commission by excising the alternative causes from the causal model with which they reasoned during predictive inferences. In Experiment 2, we assessed whether changing the representation of the alternative cause would affect participants’ inferences. We varied whether the alternative was described as the net influence of “one or more other features” (the implicit condition) as in Experiment 1 or as a single explicit category feature (the explicit condition).
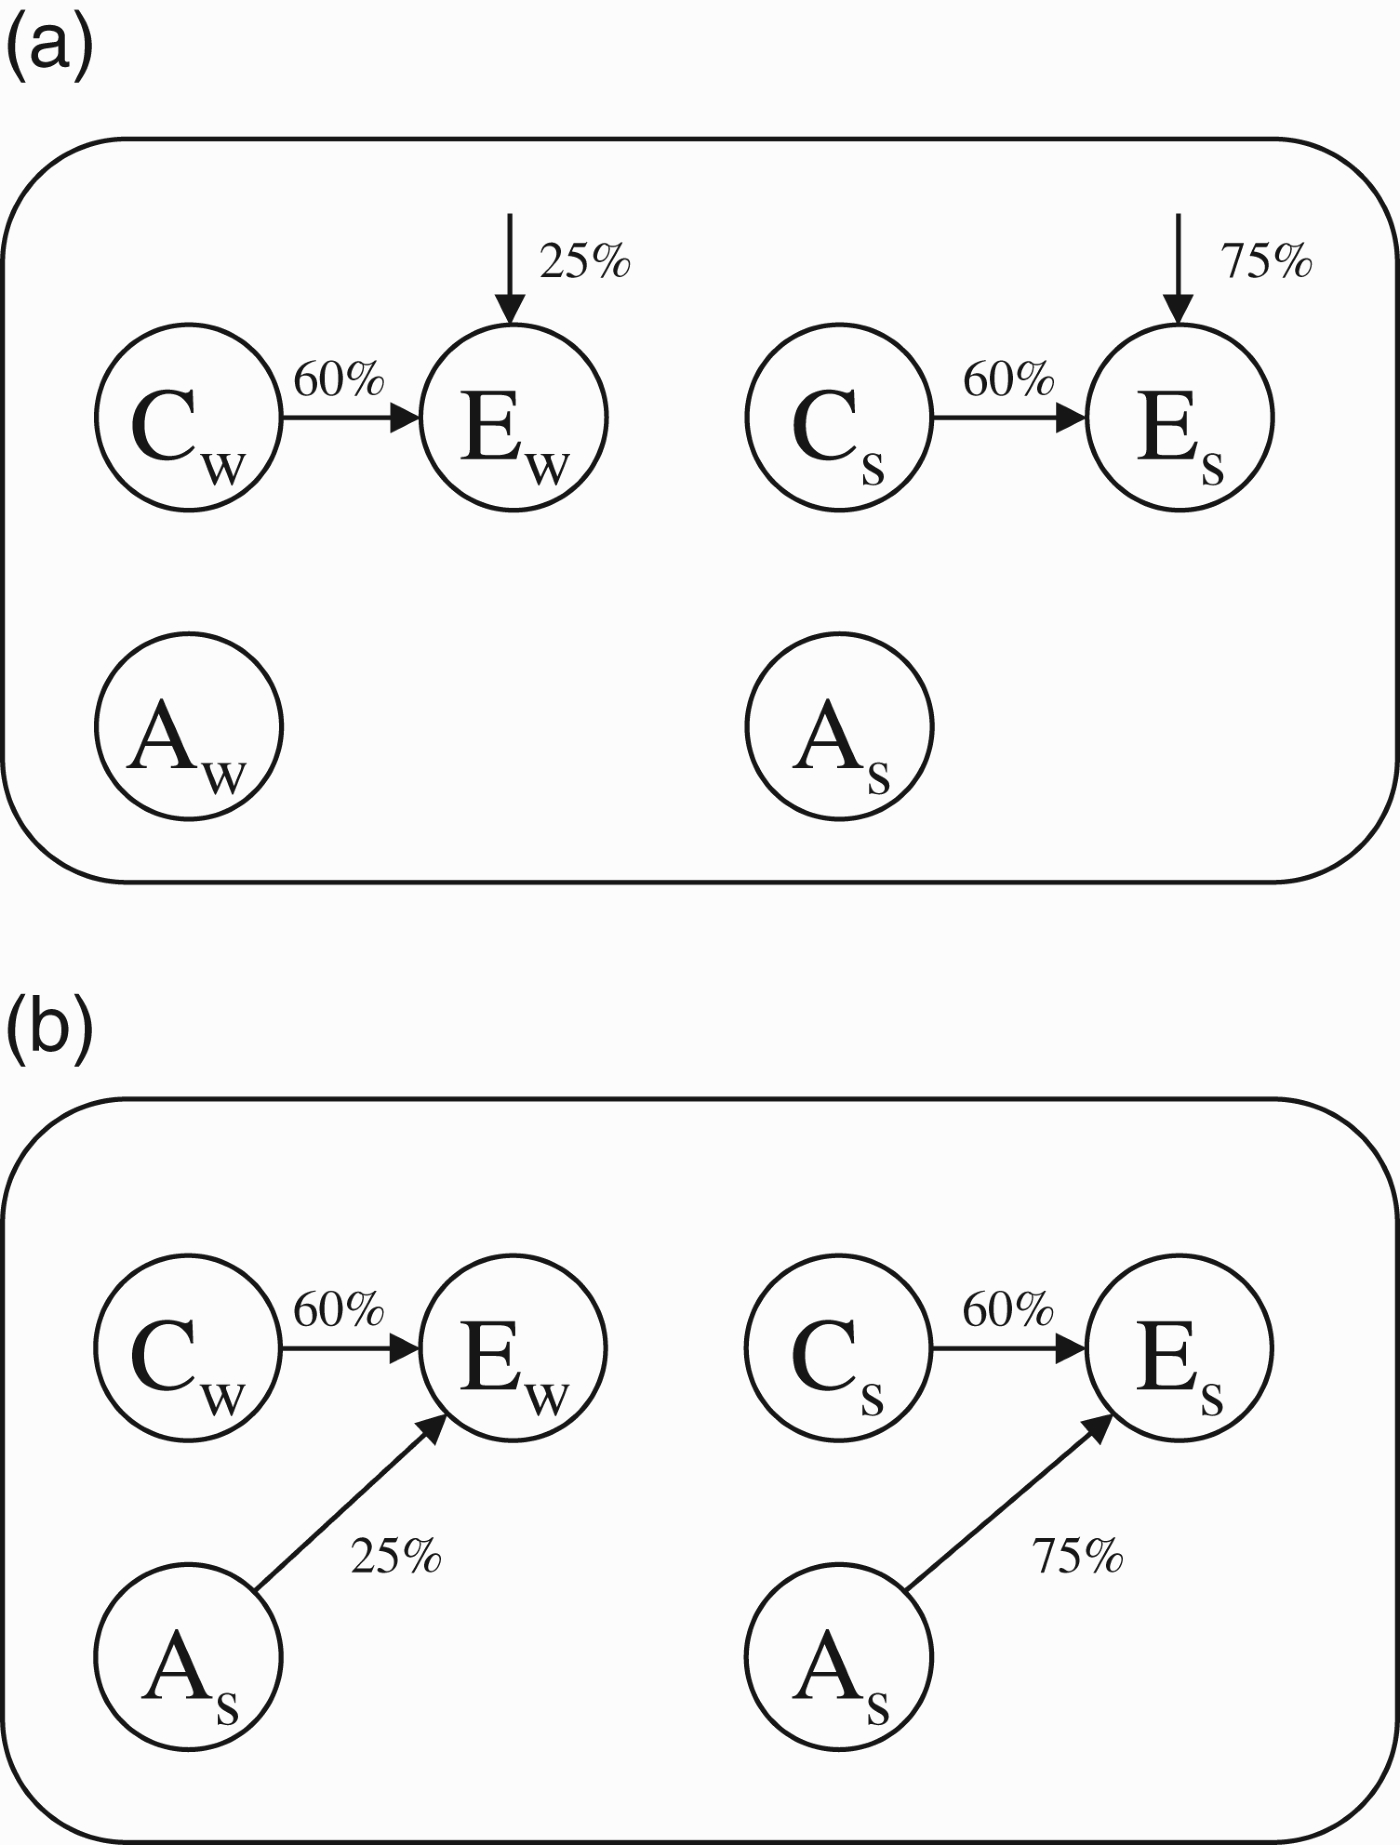
Participants were taught one of the category structures in Figure 5. All subjects learned categories with six binary features. Features Cw and Cs were described as causes of Ew and Es, respectively, each with a strength of 60%. Whether or not the alternative causes of the effect features were explicit was manipulated as a between-subjects variable. In the implicit condition, the alternative causes of Ew and Es were described as “one or more other” category features (Figure 5(A)). In the explicit condition, the alternative causes of Ew and Es were two of the category's instructed features, namely, Aw and As, respectively (Figure 5(B)). Alternative cause strength was again manipulated as a within-subjects variable in both conditions, with the alternative for Es (75%) being stronger than the alternative for Ew (25%).
Figure 5.
Causal structure tested in Experiment 2: (A) implicit alternative cause condition and (B) explicit alternative cause condition.
Two additional changes to the materials were made. First, recall that in Experiment 1 subjects were given information regarding the likelihood of an effect when the known cause was absent (e.g. “…even when its known cause (high density) is absent, a large number of planets occurs in x% of all Myastars”). To make the explicit and implicit conditions of Experiment 2 comparable, analogous information was provided for the explicit alternative causes
Second, recall that Experiment 1 found evidence that some subjects interpreted the causal links as having a dual sense (e.g. high density causes a large number of planets and low density causes a small number of planets; see Footnote 3). To address this possibility, subjects in Experiment 2 were told that most Myastars had high density and some had low density, they had either high or normal density. With this wording, we felt that they would be unlikely to assume a causal link between atypical feature values (e.g. that normal density causes a normal number of planets).
Although the intent of Experiment 2 is to assess whether a more explicit representation will yield greater sensitivity to alternative causes, it introduces a computational requirement that was absent in Experiment 1, namely, the need to integrate over hidden variables. Computing the influence of the alternative cause in the explicit condition requires multiplying its causal power (WA) by the probability it is present (PA) in the manner specified by Equation (3). Thus, making the alternative cause explicit may result in less sensitivity to alternative cause strength relative to the implicit condition. Experiment 3 will test conditions in which the alternative is explicit but the need for integration is avoided.
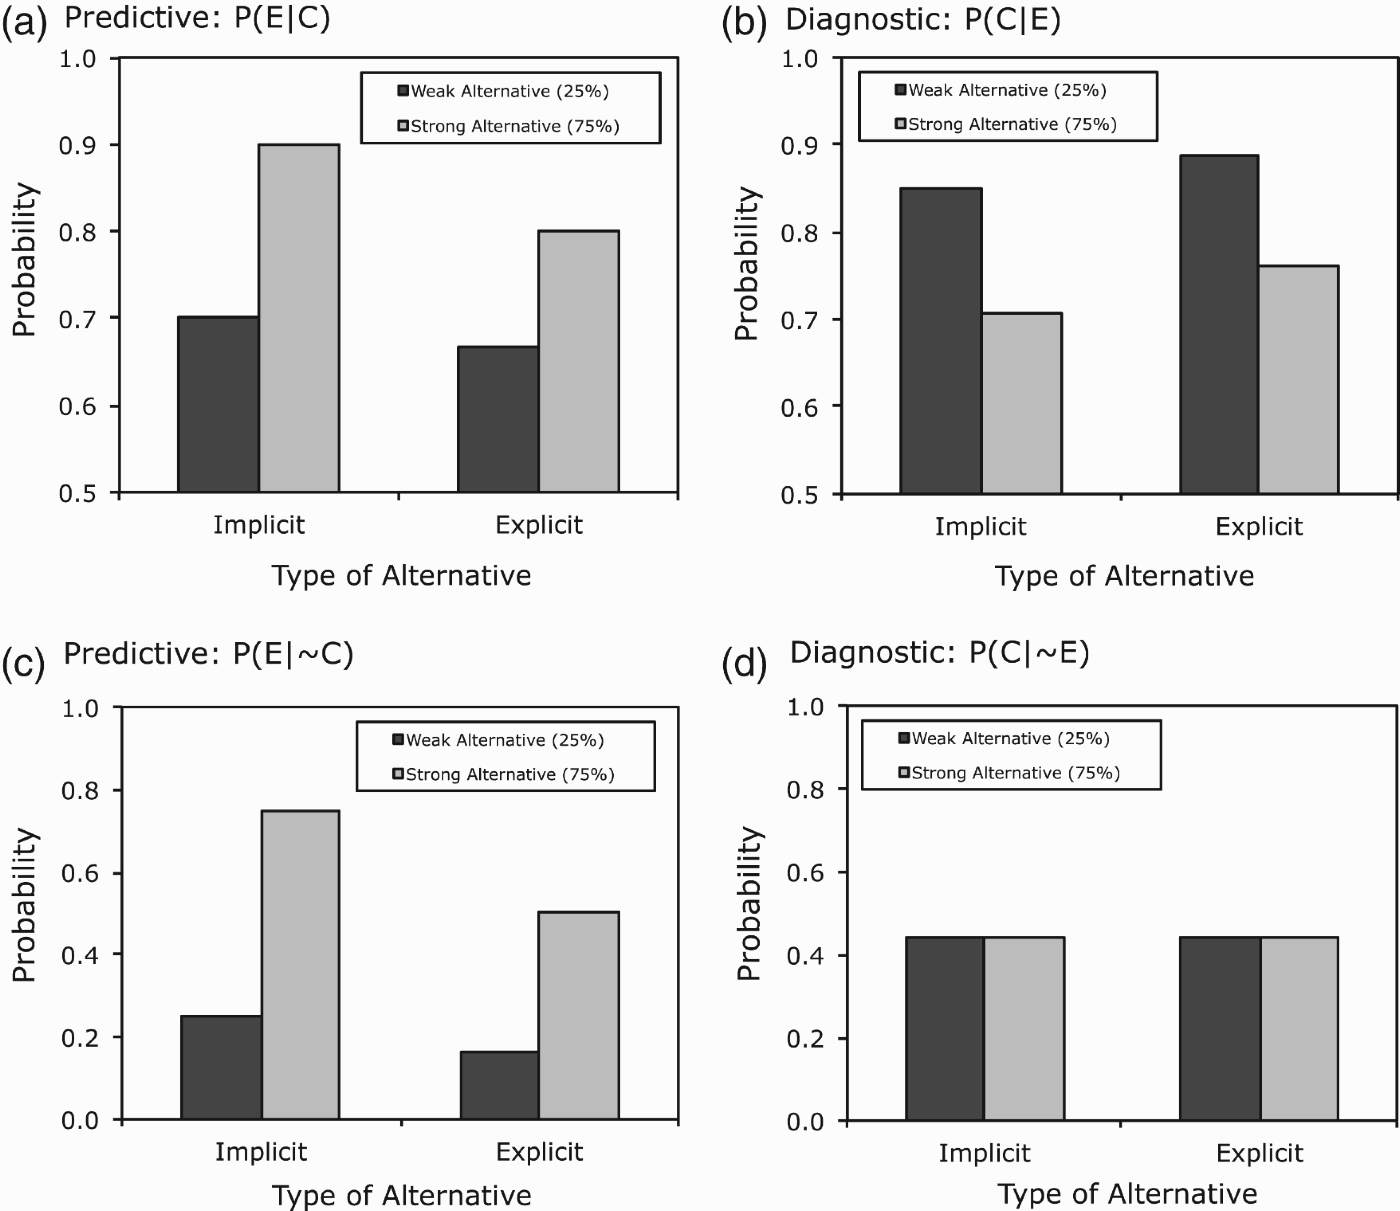
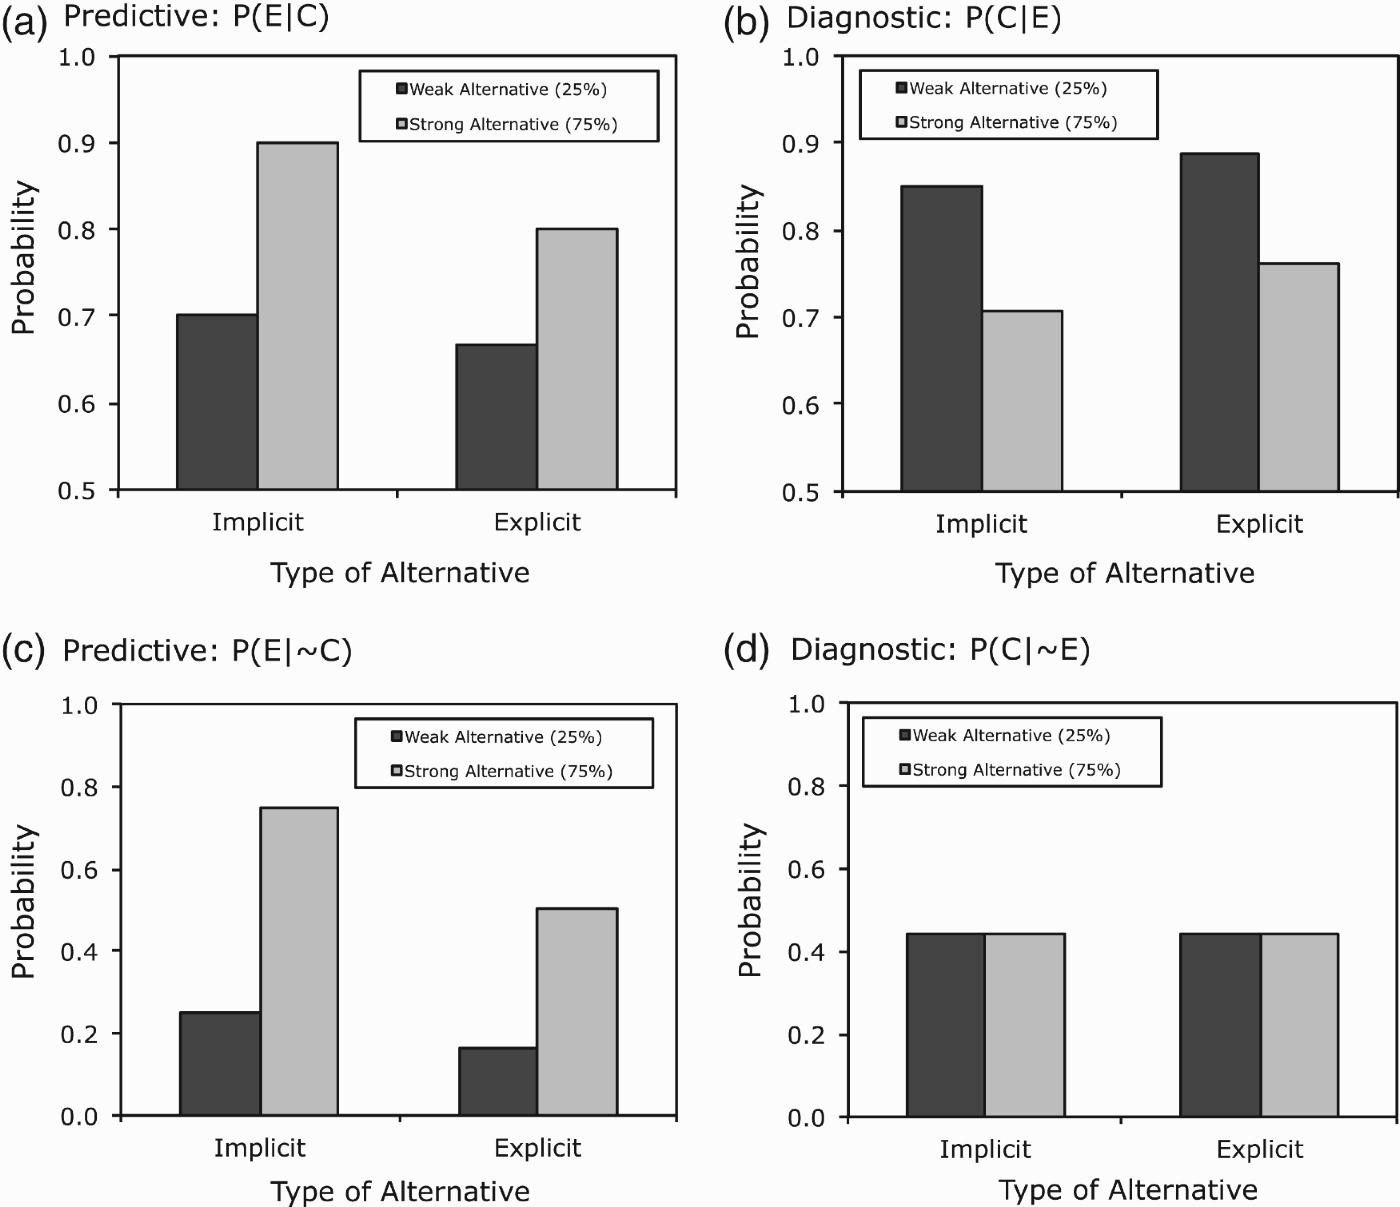
Figure 6 presents the normative predictions for Experiment 2.55 Both predictive inferences (Figure 6(A) and (C)) and diagnostic inferences in which the effect is present (Figure 6(B)) should be sensitive to the strength of the alternative causes. However, that sensitivity should be weaker in the explicit condition (because of the need to multiply by
Figure 6.
Normative predictions for Experiment 2. Predictions are generated assuming a base rate of 0.67 for both focal (Cw and Cs) and alternative (Aw and As) causes. (A) Inferring an effect given the presence of its cause, (B) inferring a cause given the presence of its effect, (C) inferring an effect given the absence of its cause, and (D) inferring a cause given the absence of its effect.
Method
Materials
The materials were identical to those in Experiment 1 except for the two extra features and two extra causal relations required by the category structures in Figure 5, the more specific information about causal strength, and the “normal” wording for atypical features. The assignment of category features to their abstract roles (Cw, Aw, Ew, Cs, As, and Es in Figure 5) was balanced over subjects so that a triple of features played the roles of Cw, Aw, and Ew for half the subjects and Cs, As, and Es for the other half.
Participants
Ninety-six New York University undergraduates received course credit for participating in this experiment. There were three between-participant factors: implicit vs. explicit alternative causes, the two assignment of category features to the roles of Cw, Aw, Ew, Cs, As, and Es, and which category was learned. Participants were randomly assigned to these
Procedure
The screens that presented the category materials and the multiple-choice test used in Experiment 1 were expanded in this experiment to include the additional two category features and (in the explicit condition) two additional causal links. Because of the larger number of questions that resulted from Experiment 2’s more complicated categories, each presentation of the multiple-choice test only included those questions the subject had gotten wrong on the previous presentation.
As in Experiment 1, the inference test required subjects to predict the effect features given information about their causes, and to predict the causes from information about their effects. No information was provided about the state of features Aw and As. The feature likelihood test was identical to the one in Experiment 1 except that 12 features (2 on each of 6 binary dimensions) were presented. Subjects were again provided with a diagram of the causal links during the tests.
Results
Inference ratings
As in Experiment 1, initial analyses of the inference ratings revealed that there were no effects of which category participants learned or the assignment of category features to the roles of Cw, Aw, Ew, Cs, As, and Es, and so the inference ratings are presented in Figure 7 as a function of alternative cause strength and whether the alternative causes were implicit or explicit.
Figure 7.
Inference ratings from Experiment 2 as a function of whether the alternative cause was implicit or explicit and the strength of the alternative. (A) Inferring an effect given the presence of its cause, (B) inferring a cause given the presence of its effect, (C) inferring an effect given the absence of its cause, and (D) inferring a cause given the absence of its effect. Error bars are standard errors of the mean. *p<0.05. **p<0.01.
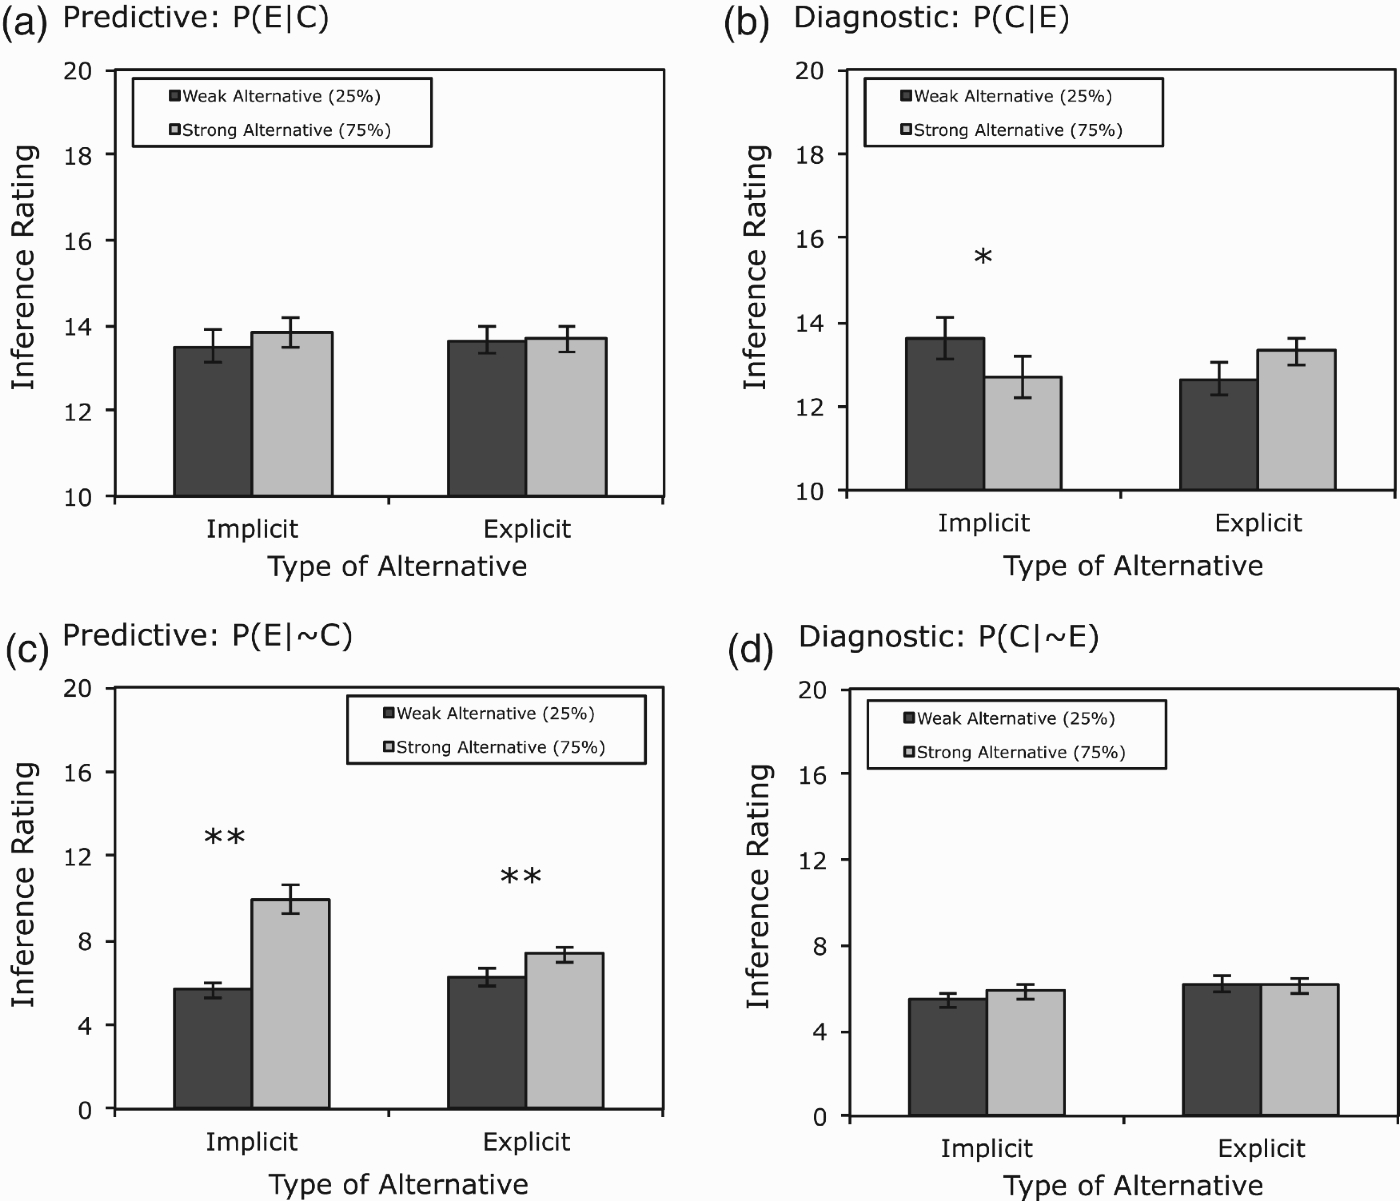
The first analysis asked whether predictive inferences (Figure 7(A)) would be more sensitive to alternative cause strength when the alternative was explicit or implicit. In fact, ratings in the strong alternative condition (13.8) did not differ from those in the weak one (13.7). A 2×2 ANOVA with alternative cause type as a between-subject factor and alternative strength as a within-factor subject revealed no effect of type, F<1, no effect of strength, F(1, 94)=1.62, MSE=22, p>0.20, and no interaction, F(1, 94)=1.43, MSE=22, p>0.20. The absence of an effect of alternative cause strength obtained in both the implicit and explicit conditions, t(47)=1.67, p=0.17, and t<1, respectively.
Diagnostic inferences were correctly sensitive to the strength of the alternative causes in the implicit condition (Figure 7(B)). In contrast, diagnostic inferences in the explicit condition were unaffected by alternative cause strength. That is, not only did making the alternative cause an explicit category feature not result in greater sensitivity to alternative causes during predictive inferences, it made them less sensitive to that information during diagnostic inferences. A 2×2 ANOVA revealed no main effect alternative cause type, F<1, no effect of alternative cause strength, F<1, but a type × strength interaction, F(1, 94)=8.49, MSE=86, p<0.01, reflecting the effect of alternative cause strength in the implicit but not in the explicit condition. Separate analyses found an effect of alternative cause strength in the implicit condition, t(47)=2.43, p<0.05, but not in the explicit condition t(47)=1.70, p=0.09. For the sake of brevity, the analyses of the inferences in Figure 7(C) and (D) are provided.66
Feature likelihood ratings
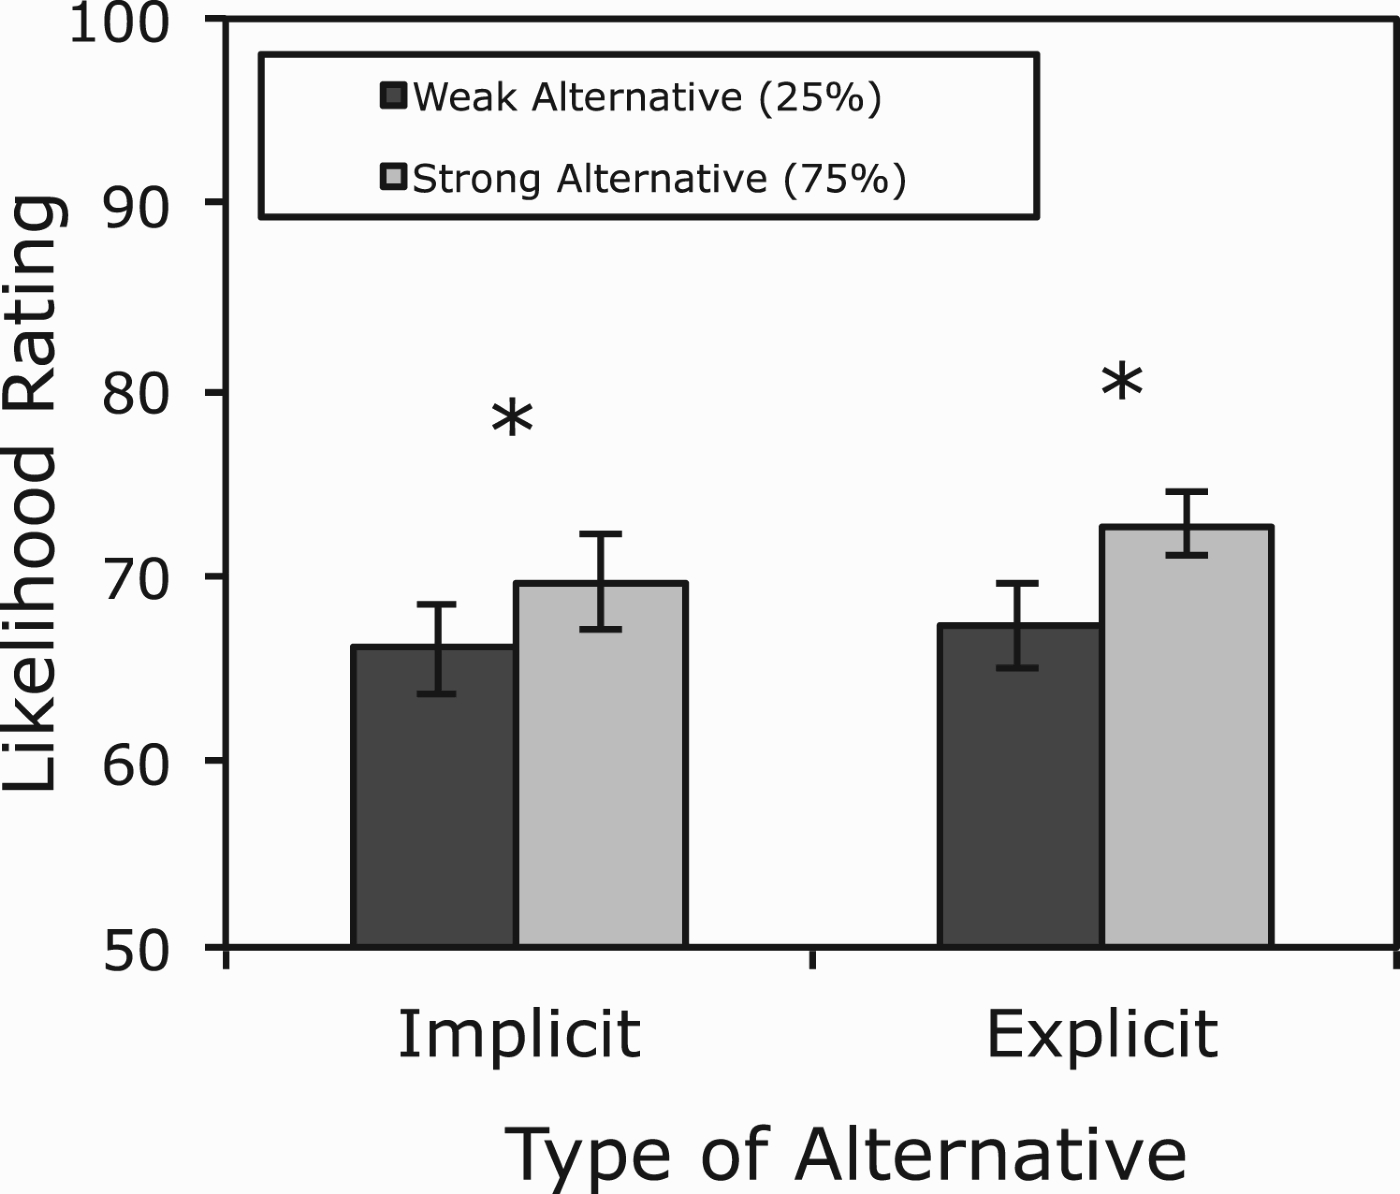
The feature likelihood ratings confirmed that subjects’ judgments of the prevalence of the effect features Ew and Es reflected the strengths of the alternative causes. The effect feature likelihood ratings presented in Figure 8 reveal that Es was rated as more prevalent than Ew in both the explicit and implicit conditions (71.2 vs. 66.7). A 2×2 ANOVA revealed a main effect of alternative strength, F(1, 94)=7.23,
Figure 8.
Likelihood ratings for the effect features (Ew and Es in Figure 5) from Experiment 2. Error bars are standard errors of the mean. *p<0.05. **p<0.01.
Discussion
In Experiment 2, making the alternative an explicit category feature did not improve predictive judgment and made diagnostic performance worse. When predicting, participants were insensitive to alternative strength in either the explicit or implicit condition. When diagnosing, they were sensitive to alternative strength in the implicit condition only. These findings support the idea that participants failed to integrate over the possible states of the alternative cause feature. Conversely in the implicit case, the critical quantity of WNetAlt – the net effect of all alternative causes – was provided in the instructions as a single parameter, making integration unnecessary.
One potential concern with this reading of Experiment 2 concerns how subjects interpreted the information we provided on the inference questions. Although we asked them to predict an effect given a cause with no information about the state of the alternative, they may have assumed that the absence of information about the alternative implied that it was known to be absent, in which case alternative strength should have no influence on the inference. Experiment 3 addresses this concern by presenting trials in which the state of the alternative cause feature is explicitly stated to be unknown.
Experiment 3
The results of Experiment 2 suggest that participants used a shortcut during integration leading to insensitivity to variation in the strength of the alternative cause. Experiment 3 further tests this possibility by again teaching subjects categories in which the alternative cause was an explicit category feature but then presenting inference questions in which the alternative cause was specified as definitely present or definitely absent. If the neglect of alternative causes in Experiment 2 was due to the difficulty in reasoning with an alternative cause whose presence was uncertain, then subjects in Experiment 3 should show sensitivity to alternative strength on trials in which the alternative cause is known to be present.
Participants were taught the category structures in Figure 5(B). In each inference question, the state of the alternative cause variable (either Aw and As) was described as present or absent. For example, when subjects who learned about Myastars were asked to predict a large number of planets (an effect) given high density (a focal cause), they were also told whether the Myastar had very hot temperature (the alternative cause) or normal temperature. That is, subjects were asked to estimate
Experiment 3 also addresses the alternative interpretation of Experiment 2 mentioned above, namely, that the lack of information about the state of the alternative cause feature implied that the feature was absent. It does so by also presenting trials in which the state of alternative cause feature is explicitly described as unknown. A finding that reasoners neglect alternative strength on these trials will rule out the possibility that those in Experiment 2 did so because they assumed that the alternative cause was absent.
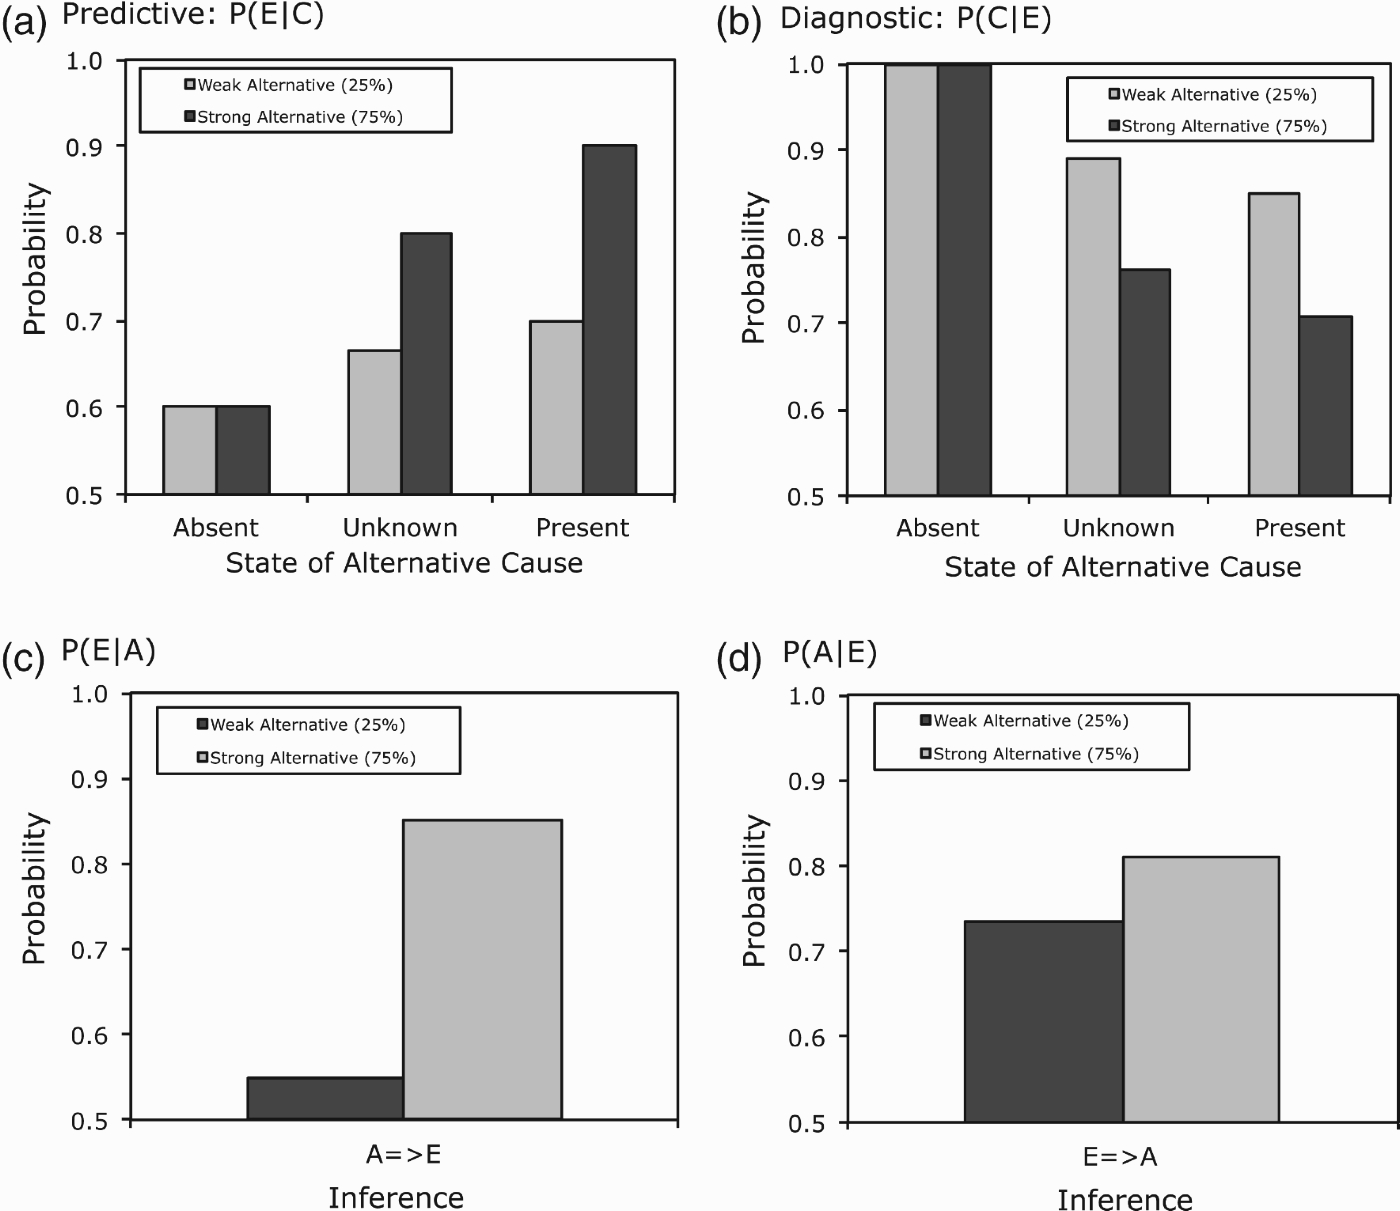
The normative predictions for this experiment are presented in Figure 9. Figure 9(A) and (B) shows that inferences in the predictive direction should become stronger as the state of the alternative cause varies between absent, unknown, and present, and diagnostic inferences should exhibit the reverse pattern. Both predictive and diagnostic inferences should be sensitive to the strength of the alternative cause when the alternative is present or unknown (albeit that sensitivity should be lower in the unknown condition) and insensitive to that strength when the alternative is absent. Inferences from/to the alternative feature and the effect (Figure 9(C) and (D)) of course should be stronger for the stronger alternative.
Figure 9.
Normative predictions for Experiment 3. Predictions are generated assuming a base rate of 0.67 for both focal (Cw and Cs) and alternative (Aw and As) causes. (A) Inferring an effect given the presence of its cause, (B) inferring a cause given the presence of its effect, (C) inferring the effect feature from the alternative and (D) inferring the alternative feature from the effect.
Method
Forty-eight New York University undergraduates received course credit for participating in this experiment. Participants were randomly assigned to the 2 (assignment of category features to roles)
Results
Inference ratings
Analyses of the inference ratings again revealed that there were no effects of which category participants learned or the assignment of category features to their abstract roles. The inference ratings collapsed over these factors are presented in Figure 10.
Figure 10.
absent, present, or unknown. (A) Inferring an effect given the presence of its cause. (B) Inferring a cause given the presence of its effect. (C) Inferring the effect feature from the alternative. (D) Inferring the alternative feature from the effect. Error bars are standard errors of the mean. †p<0.10. *p<0.05. **p<0.01.
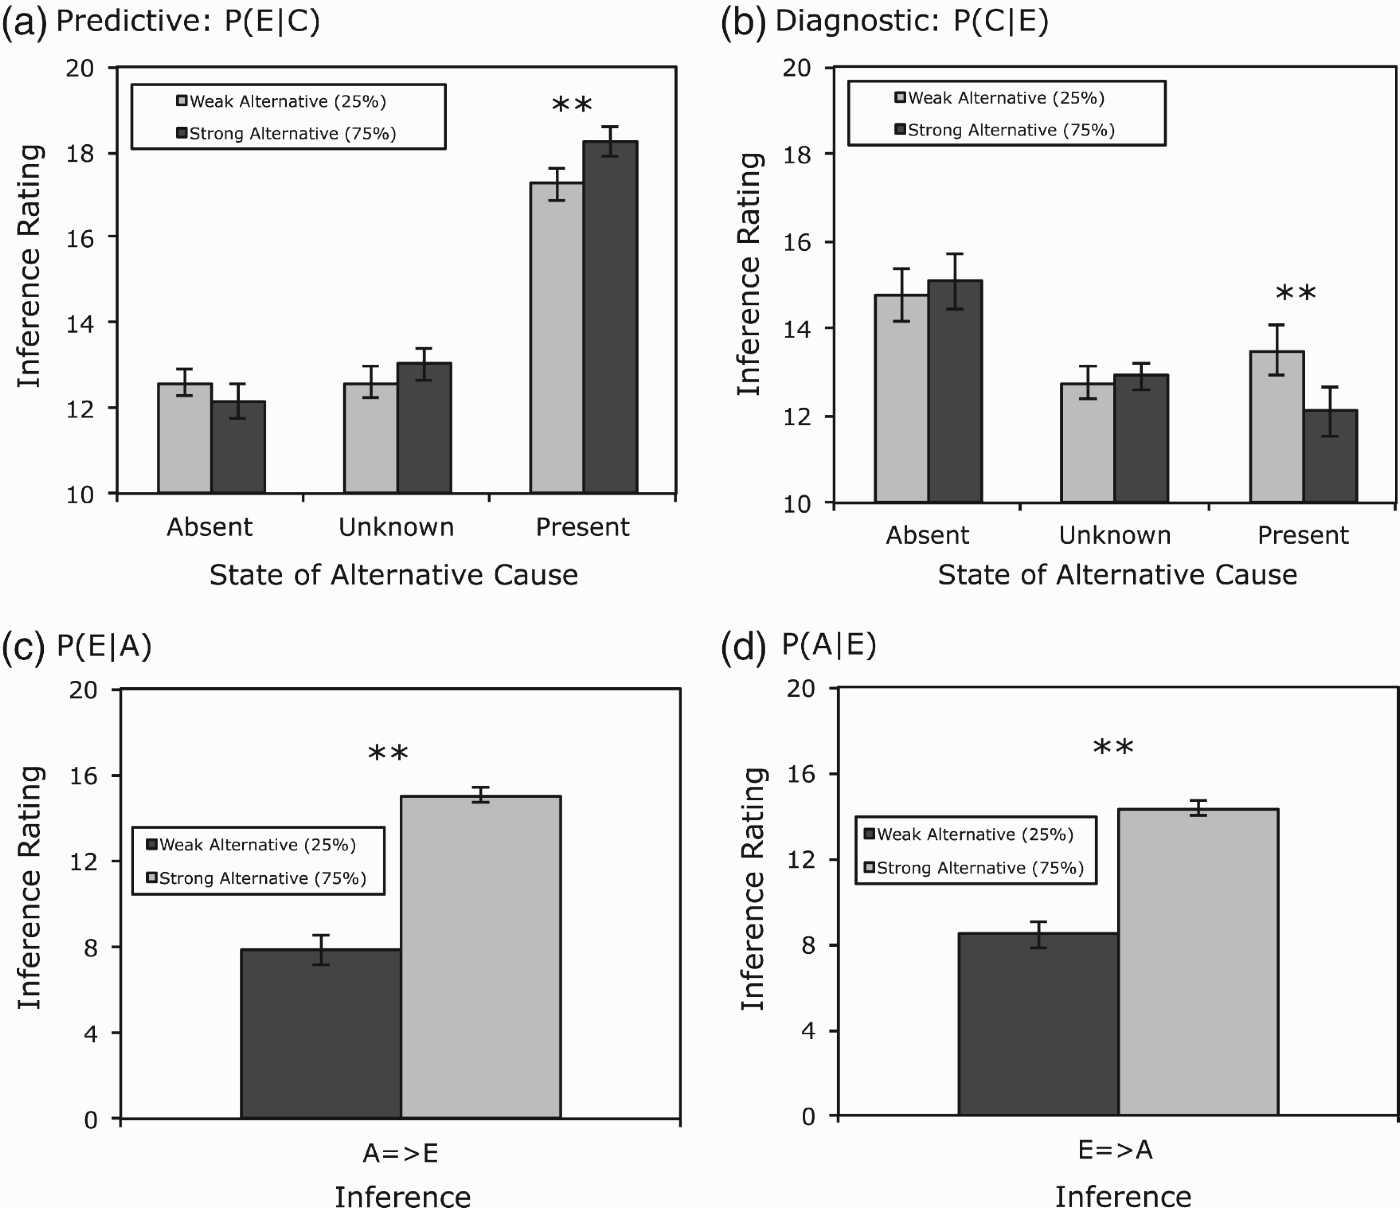
Our central question was whether causal inferences would be affected by alternative features whose state was explicitly known to be present or absent. Examining predictive inferences first, ratings were much higher when the alternative was present as compared to when absent, 17.8 vs. 12.4, respectively. These results show that reasoners readily attend to alternative causes when the state of those causes is known. More importantly, inference ratings were significantly higher for strong vs. weak alternatives when the alternative was present (18.3 vs. 17.2). This is the only experimental condition tested in this article in which predictive inferences were sensitive to the strength of alternative causes. When the alternative was described as absent, subjects correctly showed no sensitivity to alternative strength. A 3×2 ANOVA of the data in Figure 10(A) with alternative cause state and strength as within-subject factors revealed a main effect of state,
Diagnostic inferences shown in Figure 10(B) revealed an analogous pattern. Ratings were higher when the alternative was absent as compared to when present, 14.9 vs. 12.8, indicating that reasoners were also sensitive to the state of the alternative in diagnostic inferences. Moreover, when the state of the alternative feature was present, these inferences were appropriately stronger for weak vs. strong alternatives (13.5 vs. 12.1). Subjects correctly showed no sensitivity to alternative strength when the alternative feature was absent. A 3×2 ANOVA of the data in Figure 10(B) found a main effect of alternative state, F(2, 94)=8.06,
Experiment 3 also tested whether inferences would be sensitive to alternative strength when the state of the alternative cause was explicitly stated to be unknown. In fact, replicating Experiment 2, neither predictive (Figure 10(A)) nor diagnostic (Figure 10(B)) inference ratings showed sensitivity to alternative strength in this condition. Instead, ratings for these problems were very similar to those in Experiment 2’s explicit condition in which no information was provided about the state of the alternative.
Finally, the inferences involving the alternative cause feature itself showed the expected pattern. Ratings were higher for the stronger vs. weaker alternative causal link both when effect was inferred from the alternative (15.1 vs. 7.8, Figure 10(C)), t(47)=9.31, p<0.0001, and vice versa (14.4 vs. 8.5, Figure 10(D)), t(47)=8.24, p<0.0001.
Feature likelihood ratings
The feature likelihood ratings again confirmed that subjects’ judgments regarding the prevalence of the effect features reflected the strengths of the alternative causes. The effect feature with the stronger alternative cause was rated to be more prevalent than the one with the weaker alternative (73.9 vs. 69.4), t(47)=2.07, p<0.05.
Discussion
Experiment 3 established two important findings: First, the sensitivity to the strength of an alternative cause during diagnostic inferences, lost in Experiment 2, was restored so long as the alternative was definitively known to be present. Second, predictive inferences were also sensitive to alternative strength when the alternative was present. This result shows that people are not intrinsically unable to take alternatives into account when making predictions. Rather, it suggests that neglecting alternatives is due to errors in representational and computational steps leading up to the final judgment.
General discussion
Summary of results
Over three experiments we examined the types of errors that people make when judging predictive and diagnostic probability. We summarise the results by spelling out three conclusions that emerge from the current studies. First, the neglect of alternative causes is not due solely to the difficulty in retrieving those causes from memory. Evidence for this conclusion comes from all three experiments. Participants were instructed on the causal links as part of the experimental session and then provided a diagram of those relations during the inference task, but they still made errors. This does not mean that errors in causal reasoning would not be even worse in cases where alternative causes are hard to retrieve; we suspect they would be. But our results do show that although availability in memory of alternative causes may be a necessary condition for veridical causal reasoning, it is by no means a sufficient one.
Second, neglecting alternatives is also not due to strategic laziness, that is, relaxing reasoning norms only when the potential judgment error is small. Evidence for this conclusion comes from Experiment 1, which manipulated the strength of the focal cause. Although we showed that the magnitude of the error in predictive inferences, due to ignoring alternative causes, increases as the strength of the focal cause decreases, participants in Experiment 1 ignored alternative causes even when the focal cause was weak, resulting in especially egregious judgment errors. The violations of the normative model observed in Experiments 2 and 3 were also substantial in magnitude. In this regard at least, causal reasoning errors seem to share the hallmarks of heuristics, shortcuts that are applied liberally and unconsciously – and sometimes lead to serious errors.
Third, alternative causes are more likely to be ignored when there is uncertainty about either the state or identity of those causes. Our evidence for the importance of the state of an alternative cause comes from a comparison of trials in Experiment 3 in which the state of the alternative was either present or unknown: Reasoners were sensitive to the strength of the alternative causes for the former but not the latter. We believe that knowledge of the state of the alternative results in better reasoning because the need to multiply the strength of an alternative (WA in Equation (3)) by the probability that the cause is present (PA) is eliminated. Our evidence for the importance of the identity of the alternative causes comes from Experiments 1 and 2 that showed that alternatives were neglected even when their influence was provided in a summary form (i.e. as the net effect of “one or more” other causes), thus eliminating the need to compute PAWA. We believe that knowledge of the identity of the alternative results in better reasoning because reasoners are less likely to commit an error of commission by excising the alternatives from the model.
Taken together, these results support the view that people find it easier to make causal inferences when relevant knowledge can be represented simply and concretely. Situations in which variables or their states are unidentified invite reasoners to reduce effort by invoking shortcuts that can lead to error. These findings are consistent with other research showing that reasoners attend to alternative causes when all relevant causal factors are known with certainty (Rehder and Burnett 2005). It also dovetails with developmental experiments by Fernbach et al. (2011) showing that 3-year-olds are capable of diagnostic inference with known causes, but that diagnostic reasoning with uncertain causes only emerges at age 4.
Directions for future research
We have shown how specific difficulties in the representational and computational requirements of causal inference can lead to errors. But rather than abandon the normative model, we advocate an approach that identifies those subcomponents of causal reasoning that are representationally and computationally demanding and thus invite reasoners to take shortcuts. This approach has been fruitfully applied to explicate failures to adhere to the normative rules of causal learning (De Houwer and Beckers 2003; Reips and Waldmann 2008; Waldmann and Walker 2008). A promising avenue for future research would be to make use of the sort of processing load manipulations used in these learning studies to assess whether they also have the expected effects on causal inferences. Another would be to strive for an integrated account of how hidden alternative causes influence both reasoning and learning (cf. Hagmayer and Waldmann 2007; Luhmann and Ahn 2007).
Besides those we have investigated, there are of course numerous other task variables that might influence the veridicality of people's causal inferences. For example, to assess reasoning with causal models that are fully specified, we provided causal strength information in the form of explicit probabilities. Yet, the difficulty that people have reasoning with probabilities (as compared to natural frequencies) is well documented (Gigerenzer and Hoffrage 1995; also see Barbey and Sloman 2007). Thus, one might ask whether reasoning would improve if causal strength information were presented in a format that people reason with more naturally.77
Finally, although people did not exhibit strategic laziness (i.e. only taking shortcuts that lead to minimal error) in this study, this does not rule out the possibility that they have learned from experience which types of shortcuts usually result in little loss of accuracy. Indeed, the basic asymmetry between predictive and diagnostic inferences (originally documented by Fernbach et al. 2010; 2011a, and replicated here) is explicable in terms of the potential errors usually associated with these classes of inference problems. On the one hand, the magnitude of potential error due to neglecting alternatives (i.e. incorrectly treating WNetAlt in Equation (1) as if it's 0) during predictive inferences will often be small because it is bounded between the power of the focal cause and one. In contrast, if alternatives are ignored during diagnostic reasoning then the focal cause must be present (Equation (2)). Because considering even a weak or improbable alternative can thus sharply change a diagnostic inference, people may have learned from experience that ignoring alternative causes in diagnostic inferences usually leads to more serious errors than predictive ones.
Conclusion
We conclude by emphasising the empirical successes of causal Bayes nets in many cognitive domains, including inference, analogy, classification, generalisation, and learning. These results provide compelling evidence that human thinking goes beyond the associative- and similarity-based process that dominate many theories, past and present. But as sophisticated as such thinking might be, it is still vulnerable to the human desire to reduce mental effort. This research represents an attempt to understand reasoning errors within the normative causal Bayes net framework. It is true that Bayes nets cannot explain errors of reasoning, but we do believe this framework is a promising avenue for research because people are generally good causal reasoners. An apt analogy would be to a talented builder with good tools and a few bad habits. Focusing on the bad habits to the exclusion of everything else leads to a false impression. But that does not mean we should let the bad habits slide.
Notes
1 Probabilities shown in Figure 2 were generated assuming the base rate of the cause features (Pc) within category members was 0.67. Thus, because subjects were not given any information about feature base rates, the predictions are ordinal only (they only reflect the relative strength of each kind of inference).
2 The probability of the cause given the absence of the effect is given by
3 This effect is nonnormative if one interprets the causal links as having a single sense, that is, if (in Myastars for example) high density causes a large number of planets but not that low density causes a small number of planets. Under this interpretation, focal cause strength should not affect
4 This effect is not predicted by the normative model (under either the dual or single sense interpretations of the causal links) or by the effort reduction framework. It did not replicate in the following experiment and so it will not be discussed further.
5 As in Experiment 1, these (ordinal) predictions were generated assuming that Pc=0.67. In addition, predictions in the explicit condition were generated assuming a base rate of 0.67 for each alternative cause and that each Ei had no causes other than Ci and Ai.
6
Figure 7(C) shows that
7 We thank Michael Waldmann for suggesting this manipulation.
References
1 | Acevedo, M. and Krueger, J. I. (2005) . Evidential Reasoning in the Prisoner's Dilemma. American Journal of Psychology, 18: : 431–457. |
2 | Barbey, A. K. and Sloman, S. A. (2007) . Base-rate Respect: From Ecological Rationality to Dual Processes. Behavioral and Brain Sciences,, 30: : 241–297. |
3 | Beckers, T., De Houwer, J., Miller, R. R. and Urushihara, K. (2006) . Reasoning Rats: Forward Blocking in Pavlovian Animal Conditioning is Sensitive to Constraints of Causal Inference. Journal of Experimental Psychology: General,, 135: : 92–102. (doi:10.1037/0096-3445.135.1.92) |
4 | Blaisdell, A. P., Sawa, K., Leising, K. J. and Waldmann, M. R. (2006) . Causal Reasoning in Rats. Science,, 311: : 1020–1022. (doi:10.1126/science.1121872) |
5 | Cheng, P. (1997) . From Covariation to Causation: A Causal Power Theory. Psychological Review,, 104: : 367–405. (doi:10.1037/0033-295X.104.2.367) |
6 | De Houwer, J. and Beckers, T. (2003) . Secondary Task Difficulty Modulates Forward Blocking in Human Contingency Learning. The Quarterly Journal Of Experimental Psychology, 56B: : 345–357. (doi:10.1080/02724990244000296) |
7 | Fernbach, P. M., Darlow, A. and Sloman, S. A. (2010) . Neglect of Alternative Causes in Predictive But not Diagnostic Reasoning. Psychological Science,, 21: : 329–336. (doi:10.1177/0956797610361430) |
8 | Fernbach, P. M., Darlow, A. and Sloman, S. A. (2011) a. Asymmetries in Predictive and Diagnostic Reasoning. Journal of Experimental Psychology: General,, 140: : 168–185. (doi:10.1037/a0022100) |
9 | Fernbach, P. M., Darlow, A. and Sloman, S. A. (2011) b. When Good Evidence Goes Bad: The Weak Evidence Effect in Judgment and Decision-Making. Cognition,, 119: : 459–467. (doi:10.1016/j.cognition.2011.01.013) |
10 | Fernbach, P. M., Macris, D. M. and Sobel, D. M. (2012) . Which one made it go? The emergence of diagnostic reasoning in preschoolers. Cognitive Development, 27: (1): 39–53. (doi:10.1016/j.cogdev.2011.10.002) |
11 | Fernbach, P. M. and Sloman, S. A. (2009) . Causal Learning with Local Computations. Journal of Experimental Psychology: Learning, Memory, and Cognition,, 35: (3): 678–693. (doi:10.1037/a0014928) |
12 | Fernbach, P. M, Sobel, D. A. and Macris, D. (2011) . Which One Made It Go? The Emergence of Diagnostic Reasoning in Preschoolers. Cognitive Development,, in press. |
13 | Fischoff, B. and Beyth, R. (1975) . “I Knew It Would Happen”: Remembered Probabilities of Once Future Things. Organizational Behavior and Human Performance, 13: : 1–16. (doi:10.1016/0030-5073(75)90002-1) |
14 | Gigerenzer, G. and Hoffrage, U. (1995) . How to Improve Bayesian Reasoning Without Instruction: Frequency Formats. Psychological Review,, 102: : 684–704. (doi:10.1037/0033-295X.102.4.684) |
15 | Gopnik, A., Glymour, C., Sobel, D. M., Schulz, L. E. and Kushnir, T. (2004) . A Theory of Causal Learning in Children: Causal Maps and Bayes Nets. Psychological Review,, 111: : 3–23. (doi:10.1037/0033-295X.111.1.3) |
16 | Glymour, C. (1998) . Learning Causes: Psychological Explanations of Causal Explanation. Minds and Machines, 8: : 39–60. (doi:10.1023/A:1008234330618) |
17 | Griffiths, T. L. and Tenebaum, J. B. (2005) . Structure and Strength in Causal Induction. Cognitive Psychology,, 51: : 334–384. (doi:10.1016/j.cogpsych.2005.05.004) |
18 | Griffiths, T. L. and Tenenbaum, J. B. (2009) . Theory-Based Causal Induction. Psychological Review,, 116: : 661–716. (doi:10.1037/a0017201) |
19 | Hagmayer, Y. and Waldmann, M. R. (2007) . Inferences About Unobserved Causes in Human Contingency Learning. The Quarterly Journal of Experimental Pscyhology,, 60: : 330–355. (doi:10.1080/17470210601002470) |
20 | Hayes, B. K. and Thompson, S. P. (2007) . Causal Relations and Feature Similarity in Children's Inductive Reasoning. Journal of Experimental Psychology: General,, 107: : 470–484. (doi:10.1037/0096-3445.136.3.470) |
21 | Hayes, B. K. and Rehder, B. in press. “Causal Categorization in Children and Adults”. In Cognitive Science |
22 | Holyoak, K. J. and Cheng, P. W. (2011) . Causal Learning and Inference as a Rational Process. Annual Review of Psychology, 62: : 135–163. (doi:10.1146/annurev.psych.121208.131634) |
23 | Holyoak, K. J., Lee, J. S. and Lu, H. (2010) . Analogical and Category-Based Inferences: A Theoretical Integration With Bayesian Causal Models. Journal of Experimental Psychology: General,, 139: : 702–727. (doi:10.1037/a0020488) |
24 | Jordan, H. I. (1999) . Learning in Graphical Models, Edited by: Jordan, H. I. Cambridge, MA: MIT Press. |
25 | Kahneman, D. and Frederick, S. (2002) . “Representative Revisited: Attribute Substitution in Intuitive Judgment’”. In Heuristics and Biases: The psychology of Intuitive Judgment, Edited by: Gilovich, T., Griffin, D. and Kahneman, D. 49–81. New York: Cambridge University Press. |
26 | Kahneman, D. and Tversky, A. (1982) . “The Simulation Heuristic’, (Eds.)”. In Judgment Under Uncertainty: Heuristics and Biases, Edited by: Kahneman, D., Slovic, P. and Tversky, A. 201–208. New York, NY: Cambridge University Press. |
27 | Kemp, C. and Tenenbaum, J. B. (2009) . “Structured Statistical Models of Inductive Reasoning. Psychological Review,, 116: : 20–58. (doi:10.1037/a0014282) |
28 | Langer, E. J. (1975) . The Illusion of Control. Journal of Personality and Social Psychology, 32: : 311–328. (doi:10.1037/0022-3514.32.2.311) |
29 | Lee, H. S. and Holyoak, K. J. (2008) . The Role of Causal Models in Analogical Inference. Journal of Experimental Psychology: Learning, Memory and Cognition,, 34: : 1111–1122. (doi:10.1037/a0012581) |
30 | Lu, H., Yuille, A. L., Liljeholm, M., Cheng, P. W. and Holyoak, K. J. (2008) . Bayesian generic priors for causal learning. Psychological Review,, 115: : 955–984. (doi:10.1037/a0013256) |
31 | Luhmann, C. C. and Ahn, W. (2007) . BUCKLE: A Model of Unobserved Cause Learning. Psychological Review,, 114: : 657–677. (doi:10.1037/0033-295X.114.3.657) |
32 | Novick, L. R. and Cheng, P. W. (2004) . Assessing Interactive Causal Influence. Psychological Review,, 111: : 455–485. (doi:10.1037/0033-295X.111.2.455) |
33 | Opfer, J. E. and Bulloch, M. J. (2007) . Causal Relations Drive Young Children's Induction, Naming, and Categorization. Cognition,, 105: : 206–217. (doi:10.1016/j.cognition.2006.08.006) |
34 | Payne, J. W., Bettman, J. R. and Johnson, E. J. (1993) . The Adaptive Decision Maker, New York: Cambridge University Press. |
35 | Pearl, J. (2000) . Causality: Models, Reasoning, and Inference, Cambridge, UK: Cambridge University Press. |
36 | Quattrone, G. A. and Tversky, A. (1984) . Causal Versus Diagnostic Contingencies: On Self-deception and the Voter's Illusion. Journal of Personality and Social Psychology, 46: : 237–248. (doi:10.1037/0022-3514.46.2.237) |
37 | Rehder, B. (2003) a. Categorization As Causal Reasoning. Cognitive Science,, 27: : 709–748. (doi:10.1207/s15516709cog2705_2) |
38 | Rehder, B. (2003) b. A Causal-Model Theory of Conceptual Representation and Categorization. Journal of Experimental Psychology: Learning, Memory, and Cognition,, 29: : 1141–1159. (doi:10.1037/0278-7393.29.6.1141) |
39 | Rehder, B. (2006) . When Causality and Similarity Compete in Category-Based Property Induction. Memory & Cognition,, 34: : 3–16. (doi:10.3758/BF03193382) |
40 | Rehder, B. (2009) . Causal-Based Property Generalization. Cognitive Science,, 33: : 301–343. (doi:10.1111/j.1551-6709.2009.01015.x) |
41 | Rehder, B. and Burnett, R. C. (2005) . Feature Inference and the Causal Structure of Object Categories. Cognitive Psychology,, 50: : 264–314. (doi:10.1016/j.cogpsych.2004.09.002) |
42 | Rehder, B. and Hastie, R. (2001) . Causal Knowledge and Categories: The Effects of Causal Beliefs on Categorization, Induction, and Similarity. Journal of Experimental Psychology: General,, 130: : 323–360. (doi:10.1037/0096-3445.130.3.323) |
43 | Rehder, B. and Hastie, R. (2004) . Category Coherence and Category-Based Property Induction. Cognition,, 21: : 113–153. (doi:10.1016/S0010-0277(03)00167-7) |
44 | Rehder, B. and Kim, S. (2006) . How Causal Knowledge Affects Classification: A Generative Theory of Categorization. Journal of Experimental Psychology: Learning, Memory, and Cognition,, 32: : 659–683. (doi:10.1037/0278-7393.32.4.659) |
45 | Rehder, B. and Kim, S. (2009) . Classification as Diagnostic Reasoning. Memory & Cognition,, 37: : 715–729. (doi:10.3758/MC.37.6.715) |
46 | Rehder, B. and Kim, S. (2010) . Causal Status and Coherence in Causal-Based Categorization. Journal of Experimental Psychology: Learning, Memory, and Cognition, 36: : 1171–1206. (doi:10.1037/a0019765) |
47 | Reips, U. and Waldmann, M. R. (2008) . Sensitivity to Base Rates: Challenges for Theories of Causal Learning. Experimental Psychology,, 55: : 9–22. (doi:10.1027/1618-3169.55.1.9) |
48 | Risen, J. L. and Gilovich, T. (2008) . Why People Are Reluctant to Tempt Fate. Journal of Personality and Social Psychology, 95: : 293–307. (doi:10.1037/0022-3514.95.2.293) |
49 | Rottenstreich, Y. and Tversky, A. (1997) . Unpacking, Repacking and Anchoring: Advances in Support Theory. Psychological Review, 104: : 406–415. (doi:10.1037/0033-295X.104.2.406) |
50 | Shafto, P., Kemp, C., Bonawitz, E. B., Coley, J. D. and Tenebaum, J. B. (2008) . Inductive Reasoning About Causally Transmitted Properties. Cognition,, 109: : 175–192. (doi:10.1016/j.cognition.2008.07.006) |
51 | Shah, A. K. and Oppenheimer, D. M. (2008) . Heuristics Made Easy: An Effort Reduction Framework. Psychological Bulletin, 134: : 207–222. (doi:10.1037/0033-2909.134.2.207) |
52 | Sloman, S. A. (2005) . ‘Causal Models; How People Think About the World and Its Alternatives’, New York: Oxford University Press. |
53 | Sloman, S. A., Fernbach, P. M. and Hagmayer, Y. (2010) . Self Deception Requires Vagueness. Cognition,, 115: : 268–281. (doi:10.1016/j.cognition.2009.12.017) |
54 | Sobel, D. M., Tenenbaum, J. B. and Gopnik, A. (2004) . Children's Causal Inferences From Indirect Evidence: Backwards Blocking and Bayesian Reasoning in Preschoolers. Cognitive Science, 28: : 303–333. |
55 | Spirtes, P., Glymour, C. and Scheines, R. (1993) . Causation, Prediction, and Search, New York: Springer-Verlag. |
56 | Swirsky, C., Fernbach, P. M. and Sloman, S. A. (2011) . An Illusion of Control Modulates the Reluctance to Tempt Fate. Judgment and Decision Making, 6: : 688–696. |
57 | Tversky, A. and Kahneman, D. (1980) . “Causal Schemata in Judgments Under Uncertainty”. In Progress in Social Psychology, Edited by: Fishbein, M. 49–72. Hillsdale, NJ: Erlbaum. |
58 | Tversky, A. and Kahneman, D. (1983) . Extensional vs. Intuitive Reasoning: The Conjunction Fallacy in Probability Judgement. Psychological Review,, 91: : 293–315. (doi:10.1037/0033-295X.90.4.293) |
59 | Tversky, A. and Koehler, D. J. (1994) . Support Theory: A Nonextensional Representation of Subjective Probability. Psychological Review, 101: : 547–567. (doi:10.1037/0033-295X.101.4.547) |
60 | Waldmann, M. R. (2000) . Competition Among Causes But Not Effects in Predictive and Diagnostic Learning. Journal of Experimental Psychology: Learning, Memory, and Cognition,, 26: : 53–76. (doi:10.1037/0278-7393.26.1.53) |
61 | Waldmann, M. R., Cheng, P. W., Hagmayer, Y. and Blaisdell, A. P. (2008) . “Causal Learning in Rats and Humans: A minimal Rational Model’”. In The Probabilistic Mind. Prospects for Bayesian Cognitive Science, Edited by: Chater, N. and Oaksford, M. 453–484. Oxford: Oxford: University Press. |
62 | Waldmann, M. R. and Holyoak, K. J. (1992) . Predictive and Diagnostic Learning Within Causal Models: Asymmetries in Cue Competition. Journal of Experimental Psychology: General,, 121: : 222–236. (doi:10.1037/0096-3445.121.2.222) |
63 | Waldmann, M. R., Holyoak, K. J. and Fratianne, A. (1995) . Causal models and the acquisition of category structure. Journal of Experimental Psychology: General,, 124: : 181–206. (doi:10.1037/0096-3445.124.2.181) |
64 | Waldmann, M. R. and Walker, J. M. (2005) . Competence and Performance in Causal Reasoning. Learning & Behavior,, 33: : 211–229. (doi:10.3758/BF03196064) |
65 | Wells, G. L. and Gavanski, I. (1989) . Mental Simulation of Causality. Journal of Personality and Social Psychology, 56: : 161–169. (doi:10.1037/0022-3514.56.2.161) |

